Chapter 4. Tropospheric chemistry
Seinfeld and Pandis state:
“The troposphere behaves as a chemical reservoir relatively distinct from the
stratosphere.” This is an
understatement. Tropospheric chemistry
involves literally hundreds of chemicals and thousands of reactions. Most chemicals are emitted from Earth’s
surface and are subject to photolysis or chemical reactions on the way to the
stratosphere. In addition, air enters
the stratosphere at the tropical tropopause, which has a temperature of 190-220
K – a cold trap. Only chemicals that do
not condense or are not water soluble are able to pass through this trap in
substantial amounts.
While stratospheric and
tropospheric chemistry have many chemicals and reactions in common, the
troposphere also has hydrocarbons. To
study tropospheric chemistry, we will start with simple chemical systems and
move on to more complicated ones.
1. Tropospheric gas-phase
chemistry
1.2.
NOx photochemistry
1.2.1 NOx
photostationary state
At l<424 nm, nitrogen dioxide is photolyzed and the
resulting O atom quickly becomes ozone (for the most part).
NO2 + hv ® NO + O
O + O2 + M ® O3 + M
These two reactions produce
over 90% of the ozone in the troposphere.
The remaining 10% comes from the stratosphere.
What are the lifetimes of NO2
and O for typical daytime conditions? JNO2
~ 5x10⁻³ s-1 so that tNO2 ~ 200
seconds. For typical conditions at
Earth’s surface (p=1000 hPa, T = 300 K), the effective bimolecular rate
coefficient is kO+O2+M =1.5x10⁻¹⁴ cm3
molecule-1 s-1 .
To compare the speed of this reaction to that of NO2
photolysis, we must multiply this bimolecular rate coefficient by the
concentration of ozone, which is roughly 4.8x10¹⁸ molecules cm-3,
to give a first-order rate of 7.2x10⁴ s-1. Note that since the second reaction is so
much faster than the first, that the production of ozone is limited by the
photolysis of NO2 in this couplet of reactions.
But NO + O3 ® NO2 + O2
The rate expression for NO2
is:
d[NO2]/dt = - JNO2
[NO2] + kNO+O3[O3][NO]
and
d[O]/dt = JNO2[NO2]
– kO+O2+M [O][O2][M]
Look at this second
equation. Suppose we were to perturb
[O]. How long would it take to come back
to steady state? The answer can be found
by looking at the expression:
τ = { JNO2[NO2]ss
+ kO+O2+M [O2][M]}-1
JNO2 ~ 0.005 s-1 ; [O2]
~ 0.2 x 2.5x1019 cm-3
;
kO+O2+M[M] ~ 6x10-34
(300/T)2.3 [2.5x10¹⁹] = 1.5 x 10⁻¹⁴ cm3
molecule-1 s-1
or τ = {0.01 + 7.5x10⁴}-1
= 1.3 x 10⁻⁵ seconds.
We see that O so quickly
becomes O3 that O is in steady state for any change in the other
species or photolysis.
Therefore, JNO2[NO2] = kO+O2+M
[O][O2][M] =>
[O]ss = JNO2[NO2]/
kO+O2+M[O2][M]
We can perform the same
operation to see when NO2 is in steady state. We know at a minimum that this will occur in
less than 100 seconds.
Substituting for [O]ss,
we get that
[O3]ss
= JNO2 [NO2]/ kNO+O3[NO]
This is a famous
photostationary state relation that was first derived by Leighton about 40
years ago.
Let’s get NO and NO2
in terms of just NO2.
By knowing that [NO] + [NO2] = [NO]o
+ [NO2]o
and [O3]o – [O3]
= [NO]o – [NO]
and assuming that [NO]o
= [O3]o = 0, we get the expression:

The reaction rate for NO+O3®NO2+O2 is about 2x10-14
cm3 molecule-1 s-1.
Since 1 ppbv = 2.5x10¹⁰
molecules cm-3, we can rewrite this reaction rate for the surface as
kNO+O3[O3] = 5x10⁻⁴ s-1. Peak JNO2 ~ 0.006 – 0.008 s-1
at the surface, so
JNO2 / kNO+O3 ~ 10 – 15
in ppbv
Using 10 for this ratio,
[O3]ss
= ½ {[100 + 40[NO2]o]1/2 - 10}
For [NO]o = 100
ppbv, [O3]ss ~ 27 ppbv
What does [NO] equal in
steady-state?
We will revisit NOx
– O3 chemistry after we have included some hydrocarbons and CO.
Important note: Notice that the only source of oxygen atoms
in this chemical system is from either ozone or NO2. The extra oxygen atom is actually cycled
between O3 and NO2.
If all the initial NOx were in the form of NO2,
then in the light, the sum of NO2 and O3 remains
constant. New ozone is not actually
created by NOx photochemistry alone.
Let’s look at some real data
from a real city, Nashville, TN.
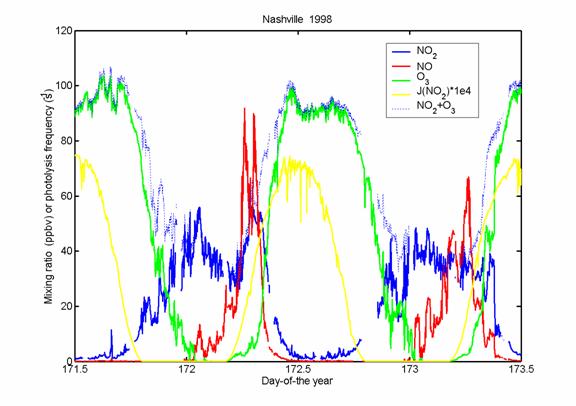
Does this picture look like
NOx photostationary state? If
it did, then the sum of ozone and NO2 should remain constant. What is going on here?
Oxidants
other than ozone.
Tropospheric chemistry
consists of much more than just NOx – O3
photochemistry. Ozone is not the only
tropospheric oxidant. In fact, the most
important oxidants are free radicals (odd number of electrons). We continue the discussion of tropospheric chemistry with the most
important oxidants: OH, O3, HO2, NO3, and the
halogens Cl, BrO, and I.
Of these OH is the most
important because it is everywhere and it reacts fairly fast with many of the
emissions. I do not intend to cover the
hydrocarbon reaction sequences in great detail.
Rather, I want you to get a sense of how the sequences go and which
types of hydrocarbons do what.
1. Hydroxyl radical, OH.
If we go to remote enough
parts of the world tropospheric chemistry simplifies.
Assume that we have this
limited chemical set. We know that the O3
will be photolyzed at wavelengths below about 320 nm.
O3 + hv ® O2 + O(1D)
However, O(1D) is
an excited state molecule that can be quenched by collisions with N2
and O2. This is mostly what
happens, resulting in the reformation of O(3P) and thus O3. That is:
O(1D) + N2,
O2 ® O(3P) + N2, O2
However, some collisions are
with H2O, which has a mixing ratio of 0.0001 to 0.05 in the
troposphere. In this case, the reaction
is exothermic, unlike the collisions with N2 and O2, and
a reaction occurs:
O(1D) + H2O
® 2 OH
The greater the amount of
water vapor, the faster OH production is.
This is the major source of OH in the atmosphere.
kN2 = 2.6x10⁻¹¹
; kO2 = 4x10-11, kH2O = 2.2x10⁻¹⁰. So, if water vapor is at 1%, what is the
fraction of reactions that go to OH?
This reaction is by far the
greatest source of OH in the atmosphere.
It is, however, not the only one.
In fact, under conditions of low water vapor and ozone, such as in the upper
troposphere, other sources can dominate.
In some sense, they result from species that are intermediates of
previous oxidation processes. Some
examples are:
HONO
+ hv ® OH + NO
H2O2
+ hv ® 2 OH
Nitrous acid, HONO, comes
from the gas-phase reaction: OH + NO + M ® HONO + M.
Another source is the reaction of NO2 and H2O on
surfaces to form HONO.
Hydrogen peroxide, HOOH or H2O2,
is formed in the gas-phase only by the reaction: HO2 + HO2
® HOOH + O2.
For environments with high
levels of ozone and alkenes, such as some cities, another important OH source
is the reaction of ozone and alkenes to form a Criegee Intermediate, which can
decompose into OH. The reaction rate
coefficients are not very fast and the OH yield is less than 1, but this
mechanism is interesting because it can make OH during both the day and the
night.
These are primary sources of
OH.
At the same time, we have in
the HOx family the reaction of HO2 + NO ® OH + NO2, where kHO2+NO ~ 8x10-12
cm-3 molecule-1 s-1. HO2 is the peroxy radical, a free
radical with an odd number of electrons. We might consider this reaction to be
a secondary source of OH, since, HO2 is quickly in photochemical
steady state with OH. Usually, this
secondary source is ~10 times larger than the primary sources.
OH is lost by chemical
reactions with many chemicals and with surfaces, as we will see later.
The resulting daytime OH
concentrations are ~(1-10) x 106 molecules cm-3.
Nighttime concentrations should be very low,
2. Ozone, O3
90% of ozone comes from the
reactions:
NO2
+ hv (l<420 nm) ® NO + O(3P)
O(3P)
+ O2 + M ® O3 + M.
kO+O2+M[M] ~ 6x10-34
(300/T)2.3 [2.5x10¹⁹] = 1.5 x 10⁻¹⁴ cm3
molecule-1 s-1
Since O2 is about
0.2 x 2.5x1019, the lifetime of O is 1.3x10⁻⁵ s.
Nothing else can compete
effectively with this reaction in the lower troposphere. The stratosphere is a different matter. So, when we get an O atom, we have ozone.
Ozone is chemically destroyed
and is also lost on surfaces.
Typical ozone mixing ratios
are ~0-20 ppbv in very remote environments, such as the upper tropical
troposphere; 30-50 ppbv in rural areas that are not heavily impacted to large
sources; 30-150 ppbv for rural areas, like State College, that are impacted by upwind
sources and for many US cities; and 30-300 ppbv for more polluted cities in the
developing world.
An aside: The air quality index in the newspaper is
simply the ozone mixing ratio is ppbv.
3. Nitrogen trioxide or nitrate radical, NO3
The source of NO3
is the reaction: NO2 + O3
® NO3 + O2.
An immediate sink is: NO3 + NO ® 2NO2
and: NO2 +
NO3 + M ↔ N2O5 + M
if N2O5
is lost by reactions on surfaces.
This reaction is not very
fast. In addition, during the day, the
lifetime of NO3 is very short (seconds). So, it is only an issue at night and only
when O3 and NOx are present. Recent studies have shown that if there is
enough O3 and NO2, such as during evening rush hour in
cities, it is possible for measurable NO3 to exist during twilight
hours.
NO3 is lost by
chemical reaction, photolysis, and surface deposition.
NO3 mixing ratios
at night are typically a few pptv to a few tens of pptv.
4. HO2
The main production of HO2
is the reactions:
H
+ O2 + M ® HO2 + M
HCO
+ O2 ® HO2 + CO
RCH2O
+ O2 ® RCHO + HO2
A large source of H and HCO
is HCHO, which is photolyzed to produce HO2:
HCHO
+ hv ® H + HCO
H+O2+M
® HO2 + M
HCO
+ O2 ® HO2 + CO
This is an important HO2
(and thus HOx) source in urban environments, where there is plenty
of HCHO from oxidation of hydrocarbons, and in the upper troposphere, where
water vapor is only a few hundred ppm and formaldehyde is generated by both
local methane oxidation and by convection.
The typical daytime HO2
mixing ratios are a few pptv to 100 pptv.
The nighttime mixing ratios are typically ~0 to a few pptv, with much
higher values possible for certain environments.
5. Cl, Br, I.
The halogens, Cl, Br, and I
are important mainly near their source: the ocean, which contains lots of
salt. Seaspray releases the NaCl, which
can react to release the Cl. It is not
clear how important halogens are in tropospheric chemistry, except in the
springtime Arctic, where Br reactions rapidly deplete the ozone. But, we will pay some attention to these
halogens, not as reactants for hydrocarbons, but as catalytic destroyers of
ozone.
B. Lifetimes of typical
organics in the troposphere.
Usually, Br, Cl, and I have
mixing ratios of 0.01 to a few pptv, although they are hard to measure at the
low levels and there is some controversy as to their actual mixing ratios.
Chemistry
of the background atmosphere.
NOx – HOx
– O3 – CO Chemistry
If we go to remote enough
parts of the world tropospheric chemistry simplifies. However, we can still have NOx
from distant pollution or from lightning.
CO has a lifetime of a month or so, and thus reaches even the most
remote parts of the troposphere.
Assume that we have this
limited chemical set. We know that the O3
will be photolyzed.
O3
+ hv ® O2 + O(1D)
O(1D)
+ H2O ® 2 OH
The greater the amount of
water vapor, the faster OH production is.
CO
+ OH ® CO2 + H
H
+ O2 + M ® HO2 + M, which is very fast
CO
+ OH ® CO2 + HO2
HO2
+ NO ® NO2 +
OH.
And the net result is:
CO
+ 2O2 + hv ® CO2 + O3
Termination reaction:
OH
+ NO2 + M ® HNO3 + M
We solve the rate equations
for O, O(1D), OH, HO2, and O3, but not for NO,
NO2, and CO. why? Because NO2, NO, and CO are emitted
from the surface. O3 and the
others respond to these emissions in the presence of sunlight.
O3: on production
through NO2 photolysis, and on loss by cycling through NO and on
loss through photolysis of O3.
This last term is often small compared to the NO loss, which gives us
the photostationary state relationship.
OH is the “chain carrier” of
this reaction mechanism. Since OH is
required to recreate the HO2, which can then react with NO to form
NO2, we want to know how many times OH will cycle before it is lost
to the formation of HNO3.
This number of times is called
the chain length, Lc.
Lc
= kOH+CO[CO] / kOH+NO2+M[M][NO2]
The fast cycle between NO and
NO2 determines the O3 balance; the slow cycle through OH
and HO2 increases the amount of O3. Because this process requires sunlight, it is
called photooxidation.
We see that ozone is produced
if NO2 is formed by the reaction: HO2 + NO ® OH + NO2,
since
NO2
+ hv ® NO + O
O
+ O2 + M ® O3 + M
and these last two reactions
occur within a few minutes during sunlight.
So, let’s look at this system
in a qualitative way. The NOx
photostationary state can be represented by the expression:
hv
NO2 ↔ NO + O3
With CO and HOx
present, this equation gets modified:
hv
![]() NO2 ↔ NO + O3
NO2 ↔ NO + O3
![]() HO2
HO2
![]()
The reaction between HO2
and NO provides another pathway for NO to get back to NO2. At the same time, HO2 is
interacting in a cycle of its own:
hv
![]() NO2 ↔ NO + O3
NO2 ↔ NO + O3
![]()
![]()
![]()
![]() CO + OH HO2
CO + OH HO2
![]()
NO
![]()
So, we have the relatively
fast cycle between NO and NO2 and the somewhat slower cycle between
OH and HO2. Note that the
reaction with NO and HO2 effectively creates more NO2 and
thus more O3. We will discuss
this in more detail when we take up methane oxidation soon.
If there is no NO around,
what happens? HO2 reacts not
with NO but with O3:
HO2
+ O3 ® OH + 2O2
In this case, ozone is not
produced; it is destroyed. For, say, 40
ppbv of ozone, what level of NO is required for ozone to be produced and not
destroyed?
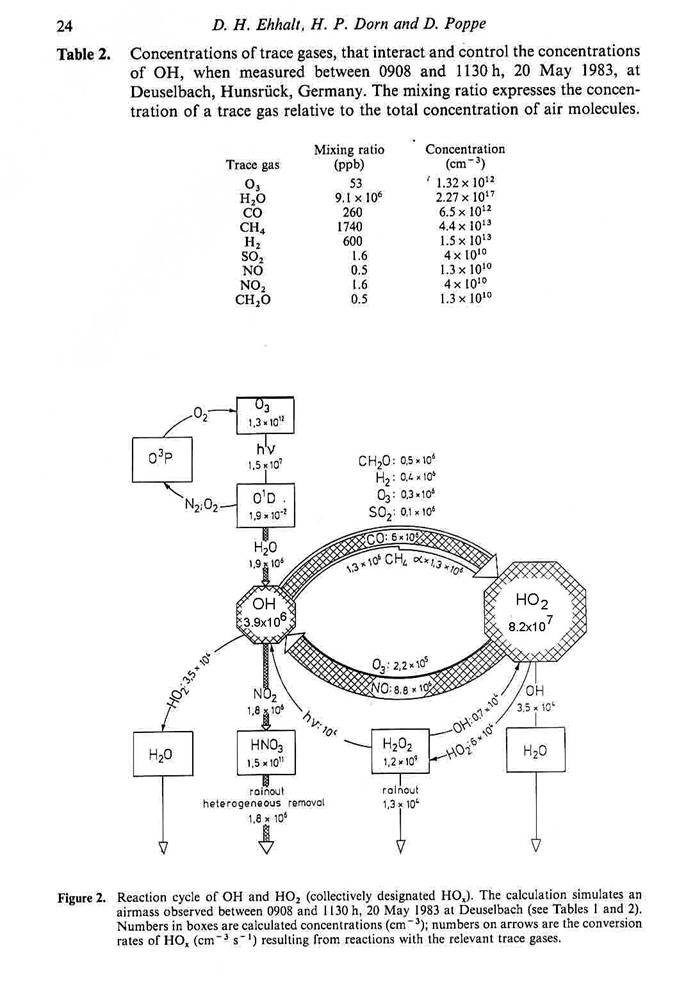
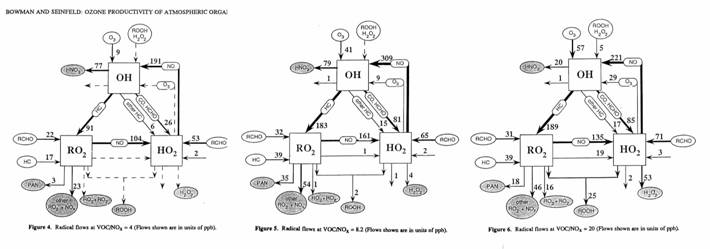
We can look at the cycling of
HOx in a quantitative way, as in the figure on the Reaction cycle of
OH and HO2. This region of
Germany is rural, but not remote. Note
that NO is actually fairly high, similar to values found in Rock Springs,
PA. Note also that the cycling between
OH and HO2 is about 5 times greater than the primary production of
OH by photolysis of ozone and reaction of O(1D) with water vapor.
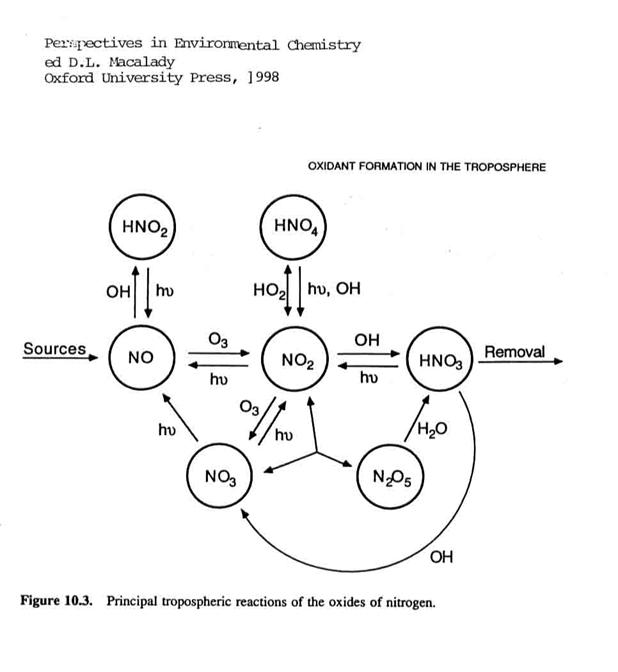
We can present a similar view
for the reactive nitrogen chemistry in the next figure. Note that the sources are generally through
NO, with rapid conversion to NO2 and eventual removal of nitric acid
(HNO3).
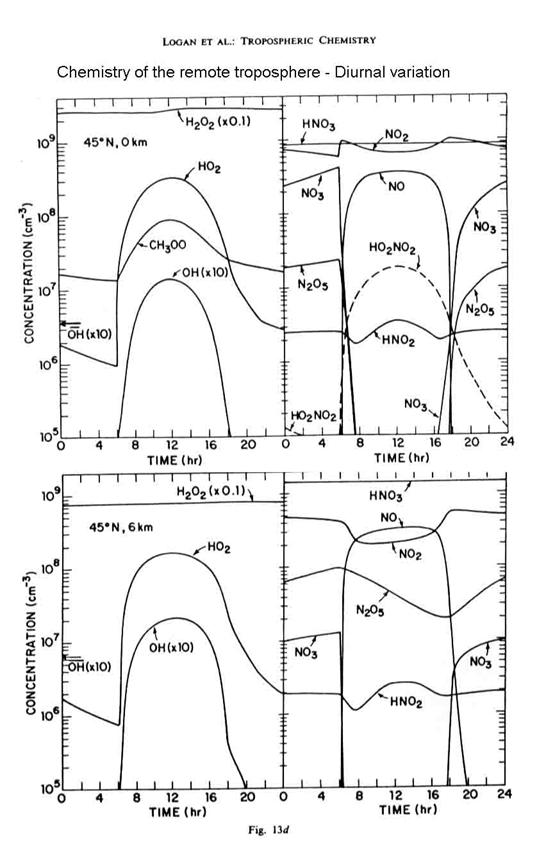
Finally, we can look at the
diurnal variation of the chemistry in the fairly remote troposphere in the next
figure. Note the shifts in the reactive
nitrogen chemistry in particular.
4.2
Variation of ozone production with [NO].
HOx, the sum of OH+HO2,
has the rate equation: d[HOx]/dt = P(HOx) – {2kHO2+HO2[HO2][HO2]
+ 2kOH+HO2[OH][HO2] + kOH+NO2+M[M][NO2][OH]} where P(HOx) is the production rate
(molecules cm-3 s-1) of HOx, OH or HO2
and the three expressions in brackets are three loss mechanisms for HOx. HO2+HO2®HOOH+O2 dominates
when NO is low, OH+HO2®H2O+O2
dominates when NO is about 100 pptv, and OH+NO2+M® HNO3+M
dominates when NO is greater than a few hundred ppt. In each one of these NO regimes, we can
assume that only the dominant HOx loss reaction is occurring. Assume that [HOx] approximately
equals [HO2], that OH, HO2, and thus HOx
are in steady-state, that the relationship that you derived for [HO2]/[OH]
in problem 4.1, section e applies, and that P(HOx) is 107
molecules cm-3 s-1, CO is 100 ppbv, O3 is
40 ppbv initially, p = 1000 hPa, T=298 K, and RO2 is
negligible. Using the equations in
problem 4.1, section d, determine the analytical expressions for [OH], [HO2],
and P(O3) in terms of
P(HOx), [NO], [CO], [O3], and rate
coefficients for the three NO regimes.
For this problem, P(O3) = kNO+HO2 [NO] [HO2].

Atmospheric chemistry of
formaldehyde and NOx.
Formaldehyde, CH2O,
is an important tropospheric molecule. It
is a common reaction product of hydrocarbon degradation and an important source
of OH, especially in urban areas.
However, recent measurements have shown larger-than-expected levels of
formaldehyde over the remote oceans and even in the uppor troposphere. This wide dispersal of formaldehyde is
strange, since its lifetime by photolysis is typically hours to a day.
The destruction of HCHO is by
photolysis and reaction with OH:
HCHO + hv ® H + HCO
(45%)
® H2
+ CO (55%)
HCHO + OH ® HCO + H2O
HCO + O2 ® HO2 + CO
The theoretical maximum
amount of O3 that can be produced is equal to the sum of HCHO and NO2.
Methane oxidation.
In the very cleanest parts of
the troposphere, which essentially do not exist any more, the chemistry comes down
to methane oxidation chemistry. The
reason is that methane reacts rather slowly with OH, its emissions into the
atmosphere are large, and therefore it is everywhere.
OH and HO2 are
deeply involved in almost all tropospheric chemistry. The major OH source is the photolysis of
ozone followed by the reaction with water vapor.
Let’s look at the oxidation
of the simplest (and perhaps) most abundant atmospheric hydrocarbon (alkane):
methane (CH4). The methane
oxidation process gives us a model of how other hydrocarbons are oxidized.
CH4 + OH ® CH3 + H2O initiation (forms
a methyl, or alkyl radical)
CH3 + O2
+ M ® CH3O2
+ M (forms
a methyl peroxy, or alkyl peroxy radical)
CH3O2
is analogous to HO2, only the O2 is joined to the carbon.
If NO is present,
CH3O2 +
NO ® NO2 + CH3O (forms a
methoxy, or alkoxy radical)_
CH3O + O2
® CH2O + HO2 (forms a
carbonyl, or formaldehyde)
HO2 + NO ® OH + NO2
CH2O + OH ® HCO + H2O
CH2O + hv ® H + HCO
HCO + O2 ® HO2 + CO
If NO is not present, then we
get the reaction sequence:
CH3O2 + CH3O2
® CH3OOCH3
+ O2
CH3O2 + HO2
® CH3OOH + O2
Several termination steps are
possible:
CH3O2 +
NO2 + M ó CH3OONO2 + M
OH + HO2 ® H2O + O2
CH3O2 +
HO2 ® CH3OOH + O2
OH + NO2 + M ® HNO3 + M
HO2 + HO2
® H2O2
+ O2
These last three steps are
not termination steps unless the peroxides or acid are scavenged by cloud drops
or rain. The most important of these is
the formation of the peroxides.
Otherwise, more steps can occur.
The net result is that:
CH4 + 4O2
+ 2hv ® HCHO + 2O3 +
H2O
The final products depend on
the relative destruction pathways for HCHO.
Once NO is converted to NO2,
it is most likely that O3 will be formed during daylight, even in the
presence of the reaction of OH + NO2. Thus, we can write ozone production rate as:
PO3 = {kHO2+NO
[HO2] + kCH3O2+NO [CH3O2]} [NO]
Further, we can re-derive the
steady-state expression for the NOx photostationary state:
[NO2]/[NO] = {kNO+O3
[O3] + kHO2+NO [HO2] + kCH3O2+NO
[CH3O2]}/ JNO2
Instruments to measure NO and
NO2 are part of the standard package of pollution measurements in
every country. It has often been thought
that it would be possible to determine the ozone production by looking at the
imbalance in the NOx photostationary state caused by kHO2+NO
[HO2] + kCH3O2+NO [CH3O2]. Despite several attempts to make this
calculation work, it generally doesn’t.
4.4
Atmospheric organic chemistry
As we move into continental environments,
the number of emitted volatile organic compounds increases.
The different classes of
hydrocarbons react at different rates with the different oxidants. We can go into the this in more detail in the
homework, but for now, I will just state the reactions in generalities.
Alkanes ( all single bonds
between carbons): OH, to a less extent NO3 and in the MBL, Cl (ALK1 and ALK2)
Alkenes (at least one double
bond between carbons): OH, O3, NO3, and some Cl in MBL
(OLE1, OLE2, OLE3)
Alkyne (at least one triple
bond between carbons): OH, Cl (MBL)
Aromatics (ring structure):
OH, Cl (MBL) (ARO1, ARO2)
Aldehydes (a double bond
between a carbon and an oxygen): OH, NO3¸ HO2, Cl (MBL)
(HCHO, CCHO, RCHO)
4.5
VOCs and NOx in ozone formation
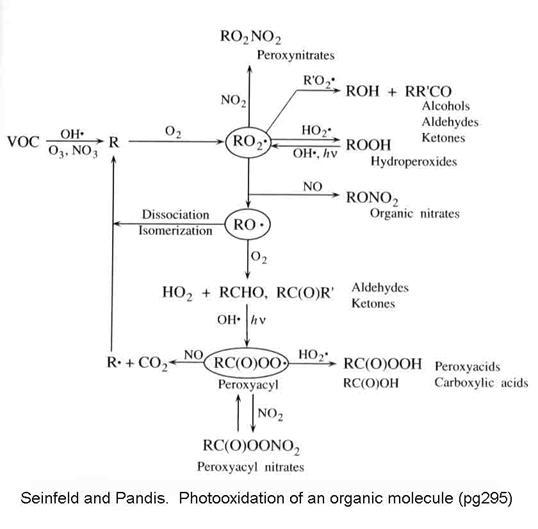
4.5.1 General oxidation
mechanism
Start with emissions of NO
and VOCs;
In the production of peroxy
radicals, an oxygen molecule is added to H or R (R= CH3, C2H5,
etc…).
The reaction of RO2
with NO creates NO2.
The product RO reacts with O2,
a hydrogen is extracted to form HO2, and a new R’O, usually a
carbonyl, is formed.
The degration products
including O3, HNO3, PAN, HCHO, and others chemicals that
are more water soluble.
The possible pathways in the
oxidation of VOCs is presented in the following figure from Seinfeld and
Pandis.
Ozone formation is strongly
correlated with higher temperatures for several reasons:
1. more emissions at higher temperatures
(isoprene is highly T dependent)
2. more sunlight due to subsidence and few
clouds;
3. suppressed vertical mixing increases surface
O3;
4. some chemical reaction rate coefficients
increase (small effect), but equilibria of species like PAN shift towards NO2
and the radicals.
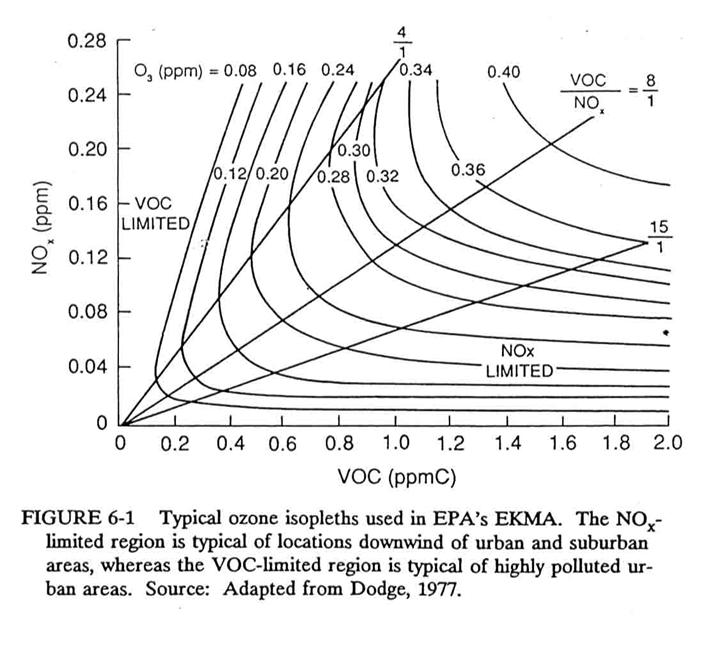
4.5.2 EKMA Diagram (ozone
isopleth diagram).
It is difficult to devise a
good regulatory strategy to control ozone, which is a secondary pollutant,
unless the fundamental processes and emissions are understood.
We know that NOx
and VOC emissions are both involved in ozone production, so we might want to
base regulatory policy on these two. But
how?
One way is to look at the
sensitivity of ozone production for different initial mixing ratios of NOx
and VOCs. By looking at the ozone
produced by a computer model that is run repeatedly for different mixing ratios
of NOx and VOCs, an isopleth diagram can be generated with VOCs on
the x-axis and NOx on the y-axis.
This diagram, first developed by Dodge and called the Empirical Kinetic
Model Approach diagram, or EKMA diagram, was used to establish regulatory
policy for the EPA.
Usually, the plot is not of
ozone production, but of the maximum amount of ozone produced in the model
after a certain period of time. Can we
derived a universal EKMA diagram? No. The total amount of ozone that is produced is
dependent on many factors: the duration allowed for ozone production, the time
of year, which affects both temperature and photolysis, the specific VOCs that
are present, the terrain, which affects the ozone surface deposition, and the
size and location of the box for which the model is run.
Conditions:
Is chosen for a particular
region, or box, which can be moving.
The time of the run is chosen
to capture the maximum ozone production.
The entire plot is generated
by changing the VOC/NOx mixture while leaving the meteorological
conditions constant.
A generic EKMA diagram is
presented below.
The hydroxyl radical is the
key to ozone formation. Both VOC’s and
NO2 compete for OH. For
instance if we take a standard urban VOC mix, then the rate coefficient for OH
loss to VOCs is about 5.5 times slower, on a per carbon atom basis, than that
to NO2. Thus, the two rates
are the same when VOC/NO2 = 5.5.
VOC/NO2
>5.5: OH reacts mainly with VOCs,
potentially producing more radicals, potentially increasing O3 in
the presence of NO.
VOC/NO2<5.5: More OH reacts with NO2 than with
VOCs, thus reducing the ozone formation efficiency.
Regions on the plot below the
ridgeline are “NOx-limited”; on this diagram, that means that
regions with VOC/NOx < 5.5 is NOx-limited.
Region above the ridgeline
are “VOC-limited”; on this diagram, that means that regions with VOC/NOx
> 5.5 is VOC-limited.
When VOCs >> NOx,
NOx is so low that RO2 and HO2 radicals are
not propagated efficiently. These
radicals react with each other and peroxides are formed. These peroxides are water soluble, can be
taken up in cloud drops and rained out.
They can also stick on the surface by dry deposition.
Above the ridgeline, HNO3
is formed in greater quantities, thus inhibiting the production of O3
because OH, and thus HOx, as well as NO2, and thus NOx,
is consumed in this terminal reaction.
Also, with radicals consumed, this is less ozone production and thus
less OH production from ozone. The just
above the ridgeline represents the maximum in OH propagation.
Decreasing VOCs for a fixed NOx always decreases O3. Decreasing NOx at a fixed VOC does
not always decrease O3. If
the level of VOCs increases for a fixed value of NOx, more radicals
will be generated that can react with the NO and more ozone will be
formed. For a fixed amount of VOCs,
however, ozone is produced more efficiently at low NO, but HO2+RO2
is competitive with HO2+ NO, so that the ozone production per HOx
molecule is smaller. As NO increases and
becomes the primary reactant with HO2 and RO2, ozone
production is at its peak. At even
higher NOx, NO2, which is approximately in steady-state
with NO, reacts with OH, inhibiting the initiation of RO2 and HO2
formation and removing NOx.
Ozone production is thus less efficient again.
We can see this behavior in
the figures below.
The ozone production
efficiency (OPE), which is the amount of ozone produced per molecule of NOx
consumed, is related to the chain length, is the number of times the
propagation steps occur divided by the rate of the termination reaction. In rural regions and cities with high VOC to
NOx ratios, such as Houston, TX, the OPE can be greater than 10,
while during rush hour in a city like New York, it can be 1-4.
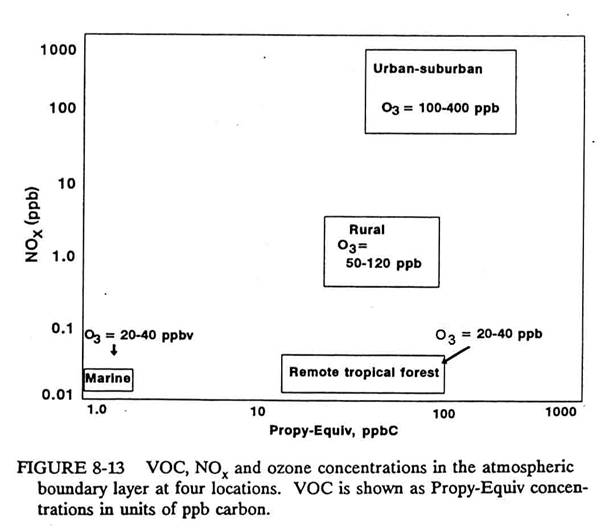
OH reactivity.
Because different VOCs react
at different rates with OH, the importance of different VOCs in ozone
production is proportional not to the concentration of the VOC, but to the
product of the VOC concentration and its reaction rate coefficient with OH. We can put all chemical species on the same
basis by normalizing to a particular reaction rate coefficient. Propene (C3H6) is
chosen.
Prop-Equiv(j) = [Aj]
(kOH+Aj / kOH+C3H6 ),
where [Aj] is in terms ppbC.
The following figure shows
propene equivalents for different environments.
Incremental reactivity.
The O3 isopleth
plot shows that the response to additional hydrocarbons can be highly
non-linear, depending on the initial conditions. This has brought about the concept of incremental
reactivity.
IR = limD[VOC]®0 D[O3] / D[VOC]
Two steps:
1. How much RO2 is generated from the
initial OH + VOC reaction (kinetic reactivity)
2. How fast NO®NO2, OH is regenerated, products formed
(mechanistic reactivity).
4.6
Regulatory strategies
The EPA website contains a tremendous
amount of information about the history and strategies of the Clean Air
Act. Please peruse their site, as I am
not going to cover the history in class.
However, I will go briefly through a summary technical document from
their website: the EPA Draft
Report on the Environment 2003. It
contains information on the National Ambient Air Quality Standards (NAAQS)
required by the Clean Air Act, the trends in the these pollutants over the last
20 years, and maps of areas that are in non-compliance with the Clean Air Act.
The primary regulatory
strategy for ozone has been to reduce VOCs.
The reason is that it is clear that reduction of NOx in the
urban cores for a fixed value of VOCs will result in an increase in ozone. I should point out that outside of urban
cores, conditions quickly transition from being VOC-limited to NOx-limited. In the past, the main efforts were to reduce
the very high ozone mixing ratios in the urban cores. This has been accomplished to a great
degree. However, at the same time, urban
sprawl has spread a lower level of ozone problem over large metropolitan areas. It is clear that a strategy that involves the
reduction of both VOCs and NOx will be required to reduce ozone
further to acceptable levels.
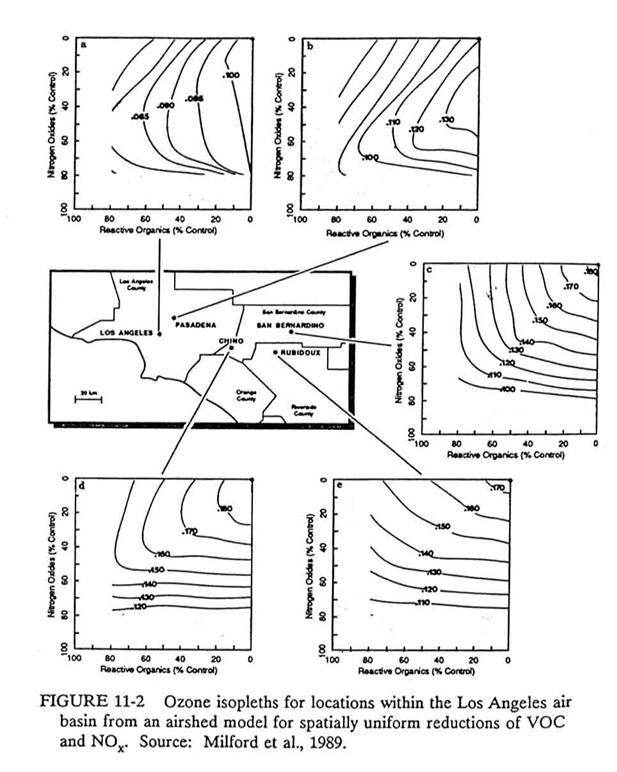
We can see the effects of
various control strategies using a model to produce ozone isopleth diagrams for
different regions within the Los Angeles basin.
4.7
Atmospheric chemistry (gas-phase) of sulfur compounds.
Sulfur oxides.
The dominant gas-phase
reaction is:
OH + SO2 + M ® HOSO2 + M
HOSO2 + O2
® HO2 + SO3
SO3 + H2O
+ M ® H2SO4
+ M
net: OH
+ SO2 + H2O ® HO2 + H2SO4
The rate-limiting step is the
reaction of OH with SO2. The
termolecular reaction rate coefficient in bimolecular form is ~9x10-13
cm3 molecule-1 s-1 for [M] = 2.5 x 10¹⁹
cm-3 and T = 300 K. For [OH]
= 4x106 cm-3, the lifetime of SO2 due to
gas-phase oxidation is: τSO2 ~ 2.8 x 10⁵ s, or about
6 days. On the other hand, its lifetime
by dry deposition in a 1 km deep layer is about 1 day, with vd ~ 1
cm s-1.
H2SO4
is rapidly taken up on aerosols. When
incorporated into cloud drops and then precipitation, it becomes acid
rain. This is what we will talk about
next.