Reactive Nitrogen and Hydrogen in the Global Atmosphere: Progress in
Measurements and Theory
Hanwant B. Singh1*, William H.
Brune2, and James H. Crawford3
1. NASA Ames Research Center, CA 94035, USA
2. Penn State University, PA 16802, USA
3. NASA Langley Research Center, VA 23681, USA
Abstract
Nitrogen oxides (NOx)
and hydrogen oxides (HOx) play a central role in maintaining the
oxidative power of the atmosphere. It
is this power that cleanses the atmosphere of its pollutants and maintains the
balance of climatically important chemicals such as methane. During the process of this oxidation many
intermediate products (such as ozone (O3), acids, and aerosols) are
formed and some of these are known to be deleterious to health and
environment. The atmospheric cleansing
efficiency is largely determined by free radicals of which the hydroxyl radical
(OH), present in extremely low concentrations of 1 in 1013 v/v, is
the most important. The concentration
of hydroxyl radicals is greatly influenced by the presence of NOx, O3
, and hydrocarbons. In the last
two decades, much effort has been expended to understand the nature and role of
the NOx-HOx-O3 photochemical system in the
global atmosphere. This period saw the
emergence of many new theoretical ideas along with the development of a suite
of highly sensitive and specific instruments to test them. It is now possible to measure nearly all of
the important known species that make up the NOx-HOx-O3
cycle. Although new discoveries continue to be made, the present conceptual
framework has been substantially validated by direct in-situ observations. In the near future, it should be possible to
make many of these measurements from space thus providing true global coverage. Here we briefly discuss the important role
of the NOx-HOx-O3 cycles in the global
troposphere, progress in measurements and theory, and remaining challenges.
Key words: Nitrogen oxides, hydroxyl radical, ozone, PAN, nitric acid, hydrogen peroxide, formaldehyde, acetone, troposphere
___________________________________________________________________
* Corresponding author: E-mail: hsingh@mail.arc.nasa.gov
1. Introduction
Under the ever-increasing pressures of population growth and industrialization, the problems of local air pollution have now become matters of global concern. A growing body of evidence shows that the earth’s atmosphere is undergoing dramatic change. Table I briefly summarizes the salient documented changes in the past 100 years and their potential consequences [1,2]. It has been a common belief that the atmosphere has some capacity to cleanse itself of chemicals and pollutants. But what is this cleansing capacity? Can we understand and measure it? Can it be perturbed by human activities and with what consequences? These are among the myriad of questions that need to be answered in order to develop a quantitative understanding of the impact of human influences on the global environment.
Hydrogen oxides and nitrogen oxides are central components of the Earth atmospheric system. They play an important role in the chemistry of the troposphere (0-12 km) and the stratosphere (12-55 km). Here we shall focus on the troposphere where more than 80% of the atmospheric mass resides and major biospheric interactions occur. Nitrogen oxides are principally made up of nitric oxide (NO) and nitrogen dioxide (NO2); and hydrogen oxides principally consist of hydroxyl radical (OH) and hydroperoxyl radical (HO2). Because they exchange rapidly, it is often convenient to treat them as HOx (OH+HO2) and NOx (NO+NO2). Together they determine the cleansing power of the atmosphere, sometimes also called its “oxidative capacity” [3,4].
Highly reactive OH is the principal natural oxidizing agent in the atmosphere. It can react with and breakdown a very large number of chemicals (e. g. hydrocarbons, nitrogen oxides, sulfur oxides, carbon monoxide) injected into the atmosphere. For this reason it has been some times called the atmosphere’s natural “detergent”. Reactions initiated by OH lead to the formation of many important intermediate species. Among those is ozone (O3) which is formed in the presence of NOx and hydrocarbons in polluted (smog) as well as remote atmospheres,. OH initiated reactions are also critically involved in processes of acid formation with many ecological consequences [5]. Particles produced by reaction of OH with many sulfur-containing gases (e.g. SO2, dimethyl sulfide) can influence cloud characteristics with significant radiative and climatic effects [6]. Hydroxyl radical provides the principal chemical filter between the fragile stratosphere and the pollution injected near the surface of the earth. Stratospheric ozone destroying chlorofluorocarbons (CFCs), that do not react with OH, are being replaced by hydrochlorofluorocarbons (HCFCs) in part because OH radicals can efficiently remove them from the atmosphere [7]. Figure 1 provides an excellent corroboration of the role of OH in defining the seasonal distribution of carbon monoxide (CO) in the northern hemisphere [8].
A quantitative understanding of the NOx-HOx-O3 system in the atmosphere has been a major focus of research in recent decades. Here we briefly discuss the important role of these cycles, progress in measurements and theory, and remaining challenges with a focus on the remote troposphere. Our intent is not to undertake a comprehensive literature review but rather to provide an assessment of the present state of this science.
2. NOx and HOx Chemistry in the Troposphere
The NOx-HOx-O3 photochemical system consists of complex interactions through which each component of the system influences the others. The existence of this photochemistry was first suggested by the work of Levy [3]. Levy extended models from the mesosphere and stratosphere to conclude that significant OH concentrations could exist in the troposphere. The photolysis of O3 constitutes the dominant source of tropospheric OH.
O3 + hn ® O (1D) + O2 (l < 340 nm) (1)
O (1D)
+ H2O ® 2OH (2)
Problem 1. In class, I showed that only a fraction of
O(1D) reacts with H2O
to form 2OH. The rest is quenched
by N2 and O2. What fraction of O(1D) reacts
with H2O if H2O is 2%
of the total number of molecules, the temperature is 25o
C, and the pressure is 1013 hPa?
OH is able to react with a large number of organic and inorganic chemicals via either abstraction or addition. The resultant reactions both destroy the parent molecules and produce a series of intermediate species. In remote atmospheres, OH rapidly converts to HO2, primarily by reaction with CO.
OH + CO (+O2) ® HO2 + CO2 (3)
Problem
2. From Figure 1. what
is the lifetime of CO at p = 900 hPa (Patm
~ 0.9) in the northern hemisphere
in January and in July? Does the observation that CO is high when OH is low make
sense? Why?
In addition to providing a source for HOx, O3 also plays a key role in partitioning NOx into NO and NO2.
NO + O3 ® NO2 + O2 (4)
NO2 + hn ® NO + O (3P) (5)
O (3P) + O2 (+M) ® O3 (+M) (6)
These three reactions represent a null cycle meaning there is no net chemical change; however, they proceed at a rapid rate (within minutes) leading to the formation of a stationary state between NO and NO2. The relative abundance of NO and NO2 are determined by the rates at which reactions 4 and 5 proceed. Given the strong temperature dependence of reaction 4, the dominant NOx species changes with altitude in the atmosphere. At the surface, NOx is mostly in the form of NO2, while NO and NO2 are roughly equivalent in the middle troposphere. At higher and colder altitudes where the rate of reaction 4 slows considerably, NO emerges as the dominant species. Figure 2 presents a typical variation in the NO2 fraction of NOx as a function of altitude.
While the conversion of NO to NO2 via O3 results in a null cycle, conversion via peroxy radicals (HO2, RO2 where R is generally any molecule in the series CnH2n+1) constitutes a net source of O3 in the troposphere. Organic peroxy radicals (RO2) are derived from the oxidation of hydrocarbons in the atmosphere. As an example, the photochemical oxidation cycle of a simple alkane (RH) is outlined below.
RH + OH (+O2) ® RO2 + H2O (7)
RO2 +NO ® RO + NO2 (8)
RO + O2 ® Carbonyls + HO2 (9)
HO2 + NO ® OH + NO2 (10)
NO2 + hn ® NO + O (3P) (2x)
O(3P)
+ O2 (+M) ®
O3 (+M) (2x)
net: RH + 4O2 ® Carbonyls + H2O + 2O3
Problem
3. The reaction HO2 + NO ®
OH + NO2 leads to ozone production, while the reaction HO2
+ O3 ® OH + 2O2
leads to ozone destruction. Thus, when
the reaction rates of the two reactions are equal, ozone production balances
ozone loss. If O3 = 40 ppbv at T = 25o
C and p = 1013 hPa, what value of NO in pptv is required so that ozone
production balances ozone loss?
In the remote atmosphere, the reactants of choice are CO and CH4, while in polluted atmospheres a vast number of non-methane hydrocarbons (NMHC) dominate this process. In addition to the formation of O3, reaction 10 represents a secondary source of OH that can exceed its primary source via reaction 2. This condition is particularly prevalent in the dry upper troposphere and in polluted atmospheres.
Reactions of the form of (9) also produce carbonyl intermediates (aldehydes and ketones) that can photolyze in the troposphere and, given the presence of sufficient NOx, produce HOx in the process. Some simple examples include formaldehyde, acetaldehyde, and acetone (see below). The importance of these compounds as a source of HOx is most pronounced in the upper troposphere (>8 km) where the scarcity of water vapor diminishes the importance of reaction 2.
CH2O + hn (+O2) ® 2HO2 + CO (11)
CH3CHO + hn (+O2) ® CH3O2 + HO2 + CO (12)
CH3COCH3 + hn (+O2) ® CH3C(O)OO + CH3O2 (13)
CH3O2 + NO (+O2) ® CH2O + HO2 + NO2 (14)
CH3CHO + OH (+O2) ® CH3C(O)OO + H2O (15)
Carbonyls that produce peroxyacyl radicals {RC(O)OO}, also influence NOx chemistry through the formation of complex organic molecules such as peroxyacetyl nitrate (PAN).
CH3CH(O)OO +NO2 « CH3C(O)OONO2 (PAN) (16)
The
decomposition of PAN and its homologues is strongly temperature dependent. At warm temperatures, as may be encountered
in the boundary layer, PAN has a lifetime of only a few hours. At colder temperatures, as may be
encountered at altitudes greater than 7 km, PAN is essentially thermally
stable.
Problem
4. If NO2
= 2x10⁹ molecules cm-3,
what is the ratio of CH3CH(O)OO to PAN at 0 km (T = 303 K; p = 1013
hPa) and at 12 km (T = 220 K and p = 200 hPa)? Recall that the equilibrium constant K = [CH3C(O)OONO2]/{[CH3CH(O)OO][NO2]}. What does this say about the amount of PAN
near the surface and in the upper troposphere?
These properties allow PAN-like materials to be effective reservoirs and carriers of atmospheric NOx [9]. In this manner relatively short-lived NOx can be transported around the globe. Other peroxy species such as HO2NO2 are also formed in small amounts and are stable only at extremely cold temperatures typically found at altitudes above 7 km.
HO2 + NO2 « HO2NO2 (17)
Hydroxyl radical reactions are
principally responsible for conversion of NOx and SO2 into
nitric and sulfuric acids, two key components of acid precipitation [5]. The loss of NOx is almost
entirely via the reaction of NO2 with OH. Due to the altitude trends in NOx partitioning
discussed earlier, the atmospheric lifetime of NOx varies with
altitude [10]. Near the surface, NOx
has a nominal lifetime of about one day.
Problem
5. Show that NOx has a
lifetime of about a day near the surface using the numbers for OH in Figure 1
and T = 27oC
and p = 1013 hPa.
In the upper troposphere, where NOx is predominantly NO, lifetimes can be as long as a week (Figure 2). The highly soluble acids are removed from the atmosphere fairly rapidly by absorption into cloud water and rainout, along with gaseous deposition in the boundary layer. This process provides the ultimate sink for these species.
OH + NO2 (+ M) ® HNO3 (+ M) (18)
OH + SO2 + O2 (+ H2O) ® H2SO4 + HO2 (19)
HOx losses in the atmosphere occur largely through the formation of peroxides.
HO2 + HO2 ® H2O2 + O2 (20)
CH3O2 + HO2 ® CH3OOH + O2 (21)
The effectiveness of these peroxy radical self-reactions as a HOx loss process increases with decreasing NOx. Recall that NOx promotes the cycling of HOx by regenerating OH from HO2 via reaction 10. Peroxides only serve as a permanent HOx loss upon removal from the atmosphere through precipitation or surface deposition. Along with aldehydes, peroxides are often referred to as reservoir species since they can easily photolyze in the troposphere to regenerate HOx.
H2O2 + hn ® 2OH (22)
CH3OOH + hn (+O2) ® CH2O + OH + HO2 (23)
While by no means complete, this summary of basic NOx-HOx-O3 interactions signifies the interdependence of these chemical species. Ozone photolysis provides the dominant source of HOx in the troposphere. It also plays an important role in the partitioning of NOx. In turn, NOx exerts a strong influence on the partitioning of HOx, while HOx controls the loss of NOx to a large extent. Finally, HOx and NOx in the presence of NMHCs provide a photochemical source of O3 in the troposphere. It is clear that the understanding of one cannot be achieved independent of the others; thus, progress in our understanding of tropospheric photochemistry must include reliable observations of each. A more detailed discussion of these cycles can be found elsewhere [11-15].
3.
salient Observations and Findings
Table II summarizes the major primary, secondary, and reservoir reactive nitrogen and hydrogen species that are present in the atmosphere. The data summarized here is obtained from a diverse number of sources that are not specifically cited. Concentrations in Table II and elsewhere are presented in volumetric mixing ratios (same as mole/mole) of parts per trillion (10-12 v/v, ppt), parts per billion (10-9 v/v, ppb), and parts per million (10-6 v/v, ppm), as appropriate. Capability to predict the complex atmospheric NOx-HOx-O3 system requires that most if not all of these species be accurately measured. This has been a constant challenge over the past several years although much progress has been made. In Table II we also provide a rough assessment of the status of the present day measurement capability and the most promising techniques currently in use.
3.1. Reactive
Nitrogen in the Troposphere
As stated in Table I, reactive nitrogen is one of the most perturbed atmospheric cycles. Estimates are that some 45 Tg (N) y-1 of NOx (mostly as NO) is emitted to the atmosphere. These emissions are dominated by continental surface sources (e.g., fossil fuel combustion, biomass burning, and soil emission) which contribute nearly 38 Tg (N) y-1 or more than 80% of total sources. The remaining 7 Tg (N) y-1 is comprised of free tropospheric sources from lightning, aircraft, and stratosphere-troposphere exchange. Biomass burning is also a source of smaller quantities {1-2 Tg (N) y-1} of nitrogen containing organic compounds such as HCN and CH3CN which are relatively long-lived (≈ 0.5 years) in the atmosphere (Table II). While most of reactive nitrogen is emitted as NO, a myriad of compounds such as nitric acid (HNO3), nitrous acid (HNO2), nitrate radical (NO3), dinitrogen pentoxide (N2O5), peroxynitric acid (HO2NO2), peroxyacyl nitrate (PAN) and its homologues, alkyl nitrates (RONO2), and peroxyalkyl nitrates (ROONO2) are rather quickly formed. Total reactive nitrogen (NOy) has traditionally been defined as the sum of the simple oxides of nitrogen and all compounds that are atmospheric products of NOx. This is especially significant as, in addition to individual species listed in Table II, it has been possible to directly measure NOy by catalytically converting the entire reactive nitrogen family to NO [16,17].
During the last decade a large number of airborne studies were conducted around the globe to acquire atmospheric data on the NOx-HOx-O3 component species (Table II) and to validate our knowledge of the atmospheric system. Many of the specific field campaigns have been summarized in the literature [18-20]. The discussion that follows is largely based on these measurements along with the ability of theory and models to understand them.
3.1.1. Reactive nitrogen budget. An early test of the measurement capability and the knowledge of the reactive nitrogen cycle involved attempts to compare measured NOy with the sum of individual species. It was discovered that there were large deficiencies in this budget and large fractions (20-60%) of the reactive nitrogen budget could not be accounted for [12,16,21]. This led to widespread speculation about the presence of hitherto unknown reactive nitrogen species. Parallel efforts were also undertaken to test and improve the instrumentation to measure individual species as well as NOy itself. Inter-comparison studies showed that it was possible to measure NO and PAN concentrations in the troposphere with reasonably accuracy (±25%). Nitric acid proved to be much more difficult and its accurate measurement became possible only in the mid-1990s. It was further discovered that nearly inert but ubiquitous atmospheric nitrogen species such as HCN and CH3CN could provide a false NOy signal. Efforts to resolve these difficulties across many laboratories led to significant improvements in overall measurement capabilities.
Figure 3 presents a modern day comparison of measured NOy with the sum of three key individual species (NOyi) based on data collected over the Pacific [23]. It is evident that NOx, HNO3, and PAN are the dominant components of the reactive nitrogen budget and can account for nearly 90% of available NOy. The remaining small shortfall is attributable to species such as alkyl nitrates (1-3% of NOy), particle nitrogen, and HO2NO2. The nearly satisfactory closure of the reactive nitrogen budget has now been verified in a variety of polluted and unpolluted environments and constitutes a major accomplishment [22,23,24]. We note that the relative amounts of individual species can vary greatly in space and time. In freshly polluted air NOx may be the dominant component, in the tropics it is usually HNO3, while PAN dominates in the cold arctic temperatures.
3.1.2. NO2 measurement and photostationary state. Another disconcerting feature of the early measurements was that the photostationary state, well established from laboratory studies, could not be verified in the remote atmosphere [25; and references there in]. The primary test was performed by a comparison of measured NO2 with that derived from NO by using the photostationary state assumption (Eq. 24).
[NO2]/[NO] = {k4 [O3] + k10 [HO2] + k8 [RO2]}/j5 (24)
Problem
6. Using only equations 4, 5, 8, and
10, and assuming that NO2
is in steady state, show that the ratio of [NO2]/[NO] is given by
equation 24.
Where ki and ji represent the rate constant for reaction (i). To distinguish thermal reactions from light dependent ones, it is conventional to use the symbol k and j, respectively. In most cases RO2 radicals have not been measured but estimated from models and are a source of some uncertainty in the use of equation 24. However, it was repeatedly found that in remote atmospheres equation 24 was not satisfied and measured NO2 far exceeded the predicted values (see Figure 4 right panel). Analysis of such data left little doubt that NO2 measurements were impacted by known (e. g. HO2NO2) and unknown interfering species. These difficulties were eventually overcome by extensive redesign of the available instrumentation. Figure 4 presents a comparison of calculated (from NO) and measured NO2 from two studies that spanned these significant changes in instrument design. The left panel in Figure 4 clearly shows the remarkable agreement in measured and calculated NO2 ratios, and validates the existence of a photochemical stationary state [26].
3.1.3. Atmospheric distribution.
An important early finding was that, in the remote atmosphere, NOx
was far more abundant in the upper troposphere and its concentrations were
extremely small in the marine boundary layer.
NOx concentrations typically varied from 1-10 ppt in the
marine boundary layer and some 50-200 ppt in the upper troposphere. Figure 5 shows the vertical structure of NO
and NO2 in the largely unperturbed equatorial Pacific
troposphere. Early observation-based
photochemical calculations quickly yielded an unexpected result, that most of
the tropospheric ozone is synthesized in the upper troposphere, and the lower
part of the remote atmosphere may actually be a net sink [27].
Problem
7. Consider air
with 80 ppbv of O3 leaving Japan in the marine boundary layer, which
extends from the ocean surface to an average height
of 300
m. If the average wind speed is 3 m s-1 and the
deposition velocity over the ocean is 0.1 cm s-1,
how far does the air travel before 90% of the ozone is lost by dry deposition?
This pattern has been corroborated many times in subsequent studies [28,29,30,31]. A second unexpected finding was that PAN, a common short-lived pollutant, was globally ubiquitous and formed an important component of the global nitrogen cycle [9,12].
Three dimensional global models have been developed to simulate existing measurements and predict future change [32,33]. Although much progress has been made, there are considerable difficulties in simulating observations. Figure 6 provides a comparison of NO measurements and results from three global models [19]. A common difficulty with nearly all models is the under-estimation of upper tropospheric NOx and over-estimation of HNO3. It is not known to what extent such disagreements are season and model dependent. It has been speculated that this could be due to unknown processes, possibly involving heterogeneous chemistry, that can convert HNO3 to NOx far more rapidly than currently believed [34]. While this idea of re-noxification is a possibility, no direct evidence of its validity is currently available. The high upper troposphere NOx concentrations also imply that significant quantities of O3 are synthesized in this region, making an accurate simulation especially important.
The suite of instruments currently available can be used to measure the main reactive nitrogen components with varying degrees of reliability (Table II). Method for the measurements of some species, such as HO2NO2, have only recently been investigated [35]. Nearly all of the efforts to date have focused on in-situ detection from fixed and mobile platforms. Such a measurement strategy is inherently limited in time and space. There is the possibility of a new generation of spectroscopic instruments that may be able to make important measurements (such as O3, NO, NO2, and HNO3) from space and provide a truly global observational data base [36].
3.2. Reactive
Hydrogen in the Troposphere
In the presence of hydrocarbons and NOx, OH initiated reactions produce a large number of important reactive oxygenated species. Table II briefly summarizes all of the key reactive hydrogen chemicals and provides an assessment of the status of the present day measurement capability. In general quantitative analysis in this group has been even more difficult than in the reactive nitrogen group. There are still limitations and uncertainties in the analysis of carbonyls (e. g. HCHO) and peroxides (H2O2) that remain to be resolved. The greatest challenge has been the direct measurement of HOx free radicals with OH being the most important. We shall briefly discuss progress in this area with a focus on the remote free troposphere.
3.2.1. Intermediate and reservoir species. Figure 7 clearly shows that the remote atmosphere contains a large number of oxygenated species many of which are photolytically active and can form free radicals. All of these are produced from atmospheric reactions involving hydrocarbons, NOx, and HOx, although some may also be emitted as primary chemicals largely from biogenic sources. In many cases our knowledge of the sources of these chemicals is quite poor. Salient species in this group are formaldehyde, acetaldehyde, acetone, methyl hydroperoxide and hydrogen peroxide. To date, most effort has been devoted to the measurements of formaldehyde (CH2O), a ubiquitous product of CH4-OH reactions. A number of direct and indirect methods have been devised and tested for CH2O analysis. In recent years there has been a shift toward spectroscopic measurements of formaldehyde as these methods are sensitive, specific, and provide a fast response. A summary of these methods and an inter-comparison at ground sites has been presented by Heikes et al. [37], Harder et al. [38], and Cardenas et al. [39]. There is some consensus that in somewhat polluted atmospheres, where concentrations are rather high, CH2O can be measured with reasonable confidence [40]. However the situation in remote atmospheres is less satisfactory. A clear remaining difficulty is the reliable detection of CH2O in the upper troposphere where concentrations are expected to be extremely low (10-30 ppt) yet critical to the HOx and O3 budget [41,42]. Currently none of the instruments possess requisite sensitivity for reliable CH2O upper tropospheric analysis. Spectroscopic instruments have been able to deduce the total atmospheric column of CH2O from space [43].
The measurement methods for hydrogen peroxide and methyl hydroperoxide have been recently reviewed by Lee et al. [14]. These complex molecules are less amenable to sensitive and specific detection by spectroscopic techniques and have largely been measured by indirect wet chemical methods in which a suitable derivative is formed and subsequently analyzed (Table II). Such methods are susceptible to interference and are inherently less specific. As with formaldehyde, current detection limits are inadequate for measurements in the upper troposphere.
Unlike formaldehyde and peroxides, interest in higher carbonyls such as acetone and acetaldehyde is somewhat recent. It has been proposed that these molecules can sequester reactive nitrogen in the form of PAN and provide sources of HOx radicals that do not depend on ozone [44,45]. In general our knowledge of the sources and chemistry of this group of chemicals is inadequate [46]. In-situ measurements have depended on gas chromatographic and chemical ionization mass spectrometric techniques [46-48]. Limited inter-comparison studies show that there are significant disagreements among instruments [47,49; also unpublished data-H. Singh].
The chemical behavior of many highly reactive chemicals (e. g. CH2O) that exist in a steady state can be described with a simple box model [15,50,51]. The presence of less reactive reservoir species (e. g. CH3OOH) in the atmosphere makes the development of 3-D models essential due to the fact that dynamical and chemical characteristics overlap. For example transport of peroxides from the surface to the upper troposphere can greatly perturb the HOx and NOx chemistry there [52,53]. The modeling study of Wang et al. [54] demonstrates the capability of a 1-D model to fit the measurements of key oxygenates in the tropics. Figure 8 presents these results for peroxides. While the agreement in the tropics appears to be quite good, significant disagreements have been observed in other places [15]. Uncertainties in the sources and sinks of higher oxygenates (such as acetaldehyde, acetone) do not allow an accurate simulation of their global distribution [46,55].
3.2.2. Hydroxyl (OH) and hydroperoxyl (HO2) free radicals. There has been much interest in the direct atmospheric measurement of OH since the 1970s. The difficulty in measurements is underscored by the fact that OH radicals are present in extremely low concentrations (105 -107 molec. cm-3), have lifetime of only 0.01-1 seconds, and are easily destroyed in contact with surfaces. Many initial attempts were unsuccessful in part due to insufficient detection sensitivity and a variety of interferences [56]. Progress in this regard mainly depended on indirect determinations of OH radicals. In the 1990’s, new technological developments made it possible to make suitable in-situ measurements of HOx radicals. Here we shall briefly review both the indirect as well as the direct in-situ techniques for measuring OH (and HO2).
Indirect methods for OH estimation. For chemicals that are mainly lost due to reaction with OH, a comparison of the amount released to the atmosphere and actually remaining should provide a direct measure of the removal rate and an indirect measure of the OH abundance. Any chemical that is principally removed by reaction with OH, can be easily measured, and whose emissions are accurately known is a candidate for this purpose. A first demonstration of this technique was presented by Singh [57] and Lovelock [58] who selected methyl chloroform (CH3CCl3), a purely man-made chemical with known sources, as a suitable OH-tracer. Other synthetic chemicals such as CHClF2 (HCFC-22) can also be used with equal effectiveness [59]. Naturally occurring chemicals, most notably 14CO, have also been used for this purpose, but they are less reliable primarily due to the inadequate characterization of sources. These indirect methods are widely used and have been recently employed and evaluated by Spivakovsky et al. [60].
During the last two decades long-term surface air measurements of CH3CCl3 have been conducted at several fixed sites around the globe [61]. These measurements have been corrected from time to time for calibration errors and can be used to determine its global burden and trends. In parallel, accurate release data have also became available [62]. Box models and 3-D global models have been used to infer the CH3CCl3 residence time from these budgets and trends [60,61,63]. Corrections are often made for the small amounts lost to the stratosphere (tstrat≈ 45 years) and to the oceans (tocean≈ 75 years). A global mean CH3CCl3 lifetime of 5.0 (±0.5) years corresponding to a mean OH concentration of 10 (±2) x 105 molec. cm-3 provides the best fit to the data.
The best use of the methyl chloroform (or HCFC-22) mean lifetime estimate is to validate the OH fields predicted by global models and to estimate lifetimes of other organic chemicals through a process of normalization assuming that their rate constants with OH are accurately known. Only a small error is incurred when lifetimes are estimated by normalizing to a mean temperature of 272˚ K. With these assumptions, the lifetime of an unknown chemical X (tX) with an OH rate constant of kOH-X can be easily calculated:
tX (years) = tMC (kOH-CH3CCl3 /kOH-X)272 = 3.0 x 10⁻¹⁴ / (kOH-X)272 (23)
Problem 8. Using the above
equation, estimate the lifetime of the following chemicals: methane (CH4),
ethane (C2H6), HCFC-122 (CHCl2CF2Cl),
and methyl chloride (CH3Cl).
The above equation provides a convenient means to determine the lifetime of all chemicals that are principally removed by OH. The rate at which these reactions take place have been extensively measured and compiled [64]. Lifetimes of HCFC’s, replacements for CFCs, are calculated in this manner [65]. All global models are currently validated against CH3CCl3 lifetime. A significant weakness of this indirect method is that it is insensitive to OH in the upper troposphere as much of the loss takes place below 8 km. In the future, it may be possible to add controlled quantities of tailor-made chemicals to act as precise indicators of OH. Detection limits would need to improve by two or more orders of magnitude before controlled tracer experiments on the global scale are feasible.
In-situ measurement of OH and HO2. There is a large amount of variability in local and regional OH concentrations. Direct observations are necessary to test our understanding of the local chemical processes that are operating throughout the troposphere. Many independent methods have been used for this purpose and have been reviewed by Crosley [66]. Three principal techniques are being actively used:
(1) Differential optical absorption spectroscopy (DOAS): This technique relies on the UV absorption line of OH at 308 nm wavelength. A laser beam is transmitted through a 5-10 km path in the open atmosphere and the absorption spectrum is detected [67]. An advantage of this method is that it depends only on the known spectroscopic properties of the OH molecule and no additional calibration is required. Disadvantages are that unknown absorbing chemicals can interfere with retrievals of the OH spectra, and the need for a very long (5-10 km), to achieve adequate sensitivity, limits its wider application. Recently, folded path methods have been used to mitigate the latter problem [68].
(2) Laser-induced fluorescence (LIF): This was one of the first techniques to be employed for OH detection. In this method OH radicals are excited using a pulsed laser and are directly detected via their fluorescence. In contrast to DOAS, the LIF technique needs to be calibrated. Current LIF instruments are highly sensitive (1-3 x 10⁵ molec. cm-3) and are being widely used in ground based and airborne studies [69-71]. The LIF technique can also be easily extended to the in-situ measurement of HO2. This is realized by adding an increment of NO to convert HO2 into OH (reaction 10) followed by its detection.
(3) Selected Ion Chemical Ionization Mass Spectrometry (SICIMS): Ion-assisted OH measurements have been performed by the addition of an excess of isotopically labeled 34SO2 and quantitative conversion to H234SO4 via OH reaction. The product ion is specifically detected in a mass spectrometer with high sensitivity and discrimination from signal originating from naturally occurring H232SO4 [72]. The performance of this technique is comparable to the LIF method. As in LIF, calibrations are required to obtain absolute concentrations. Its use has also been extended to measure HO2. The difficulty of generating accurate calibration standards has been a significant limitation in the accurate determination of OH (and HO2) concentrations.
Figure 9 shows the diurnal variation in OH as measured by a DOAS and LIF method [68]. The two instruments produced comparable data throughout the day and the diurnal behavior was found to be very much in agreement with expected theory. Field inter-comparisons between the LIF and SICIMS methods have also been performed with reasonable results [73 and references there in). The last such inter-comparison during an airborne study in 2001 (unpublished) indicates that it is possible to measure OH (and HO2) to an accuracy of ±30%. There are periods when disagreements among instruments are much larger most likely due to the difficulties in the generation of calibration standards.
A first demonstration of the utility of the in-situ techniques was the observation by Wennberg et al. [70] that upper troposphere OH levels far exceeded those predicted by theory. The OH field in this region was largely unverified due to the insensitivity of the CH3CCl3-OH method here. These measurements coincided with the proposal by Singh et al. [44] that organic molecules such as acetone could be important sources of OH radicals in the upper troposphere where lack of sufficient water vapor limits the ability of reaction 2 to produce sufficient radicals. Measured OH could be better reconciled with theory when acetone generated OH source was added to the models (Figure 10). Figure 10 also indicates that increase in HOx production rates far exceed that in net OH abundance, in part because loss rates also correspondingly increase. The parallel increases in production and loss rates have the net effect of buffering the atmospheric HOx system.
Extensive measurements of both OH and HO2 have been performed at many different locations in the global troposphere. These measurements have directly tested some of the basic features of their chemistry. For example, atmospheric measurements of OH and HO2 by Brune et al. [74] in the free troposphere directly demonstrated the relationship between OH and HO2 as a function of NO. The daytime vertical distribution of OH and HO2 in the Pacific troposphere, as measured by an LIF instrument, is shown in Figure 11 [71]. It is evident that the controlling reactive radical (OH) in the troposphere is present at a concentration of only about 0.1 ppt. Since other key species (NOx, O3, H2O, peroxides etc.) were also measured it is possible to compare theory and measurements. This comparison is shown in Figure 12 and indicates relatively good agreement with a few exceptions. Similar modeling studies have also been performed with data sets from multiple field missions with comparable results [42]. A continuing feature is the inability of theory to explain measurements made at high NO concentrations. Whether this is due to shortcoming in theory or a measurement artifact is not known.
3.2.3. Trends in OH. Has the oxidation or cleansing power of the atmosphere been altered by human activities? Because of the central role of OH in balancing the composition of the atmosphere, there has been great interest in determining long-term secular trends in its concentrations. Atmospheric OH can increase or decrease depending on the type of atmospheric perturbation. Under typical conditions prevalent in the global troposphere, increases in NOx and decreases in stratospheric ozone will tend to increase HOx, while increases in methane and CO, its main reactants, will tend to decrease it.
Problem
9. Why do you think that, in the remote
troposphere, increases in NOx and decreases in stratospheric ozone
tend to increase HOx while increases in methane and CO tend to
decrease HOx? Please be
brief.
In reality these changes have occurred concurrently and are not accurately quantified. Thus models do not provide a reliable means of establishing atmospheric trends in OH although several estimates have been published.
Once again, a comparison of measured atmospheric concentrations and emissions of CH3CCl3 has been used for the purpose of extracting an OH trend. Using an observational data set collected over the period of 1978-1994, Prinn et al. [61] and Krol et al. [75] inferred a trend of 0±0.2% yr–1 and 0.5±0.6% yr–1, respectively. More recently, Prinn et al. [76] report that the OH trend, although highly uncertain, was positive in the 1980’s and negative in the 1990’s resulting in a near zero change over the entire period. Uncertainties in CH3CCl3 measurements and emission rates, as well as non-linearities in the relationship between CH3CCl3 and OH make the reliable detection of a rather small trend extremely difficult. An analysis of these difficulties and future prospects for OH trend detection has been recently discussed by Lawrence et al. [77] and Jöckel et al. [78]. The lack of a significant trend implies that even though OH is highly reactive and short-lived, it exists in nature in a highly buffered and protected state. Nevertheless, systemic changes in atmospheric oxidative efficiency remains an important question that will continue to be closely monitored.
4.
Conclusions
The study of remote atmospheres has greatly matured in the last two decades. It is now possible to measure nearly all of the important known species that define the oxidative power of the atmosphere. Fundamental chemical reactions operating in the global troposphere and relationships among them have been identified and sometimes fully explained. The atmospheric system is highly buffered in a manner such that large increases in human induced emissions do not appear to have significantly altered the atmosphere’s cleansing capacity. The earth atmosphere is a highly complex system and the presence of unanticipated and unexplained phenomena is the rule rather than the exception. The ability to measure atmospheric species at even greater sensitivities will no doubt reveal new phenomena and allow opportunities for further discoveries.
Acknowlegement: We thank the NASA Tropospheric Chemistry Program for support and encouragement. Comments by L. Iraci and R. Chatfield of the NASA Ames Research Center are appreciated
5. References
1. WMO (World
Meteorological Organization), Scientific
Assessment of Ozone Depletion: 1998, Global Ozone Research and Monitoring
Project – Report No. 44, 1999.
2. IPCC, Climate change 2001- The scientific basis, WMO, Switzerland, 2001.
3. H Levy II Science 173(1971) 141
4. A M Thompson Science 256(1992) 1157
5. J G Calvert et al.
Nature 317(1985) 27
6. R J Charlson, J E Lovelock,
M O Andreae, and S. G. Warren Nature 326(1987) 655
7. L. E. Manzer Science 249(1990) 31
8. P C Novelli, K A Masarie, and P M Lang J. Geophys. Res. 103(1998) 19015
9. H B Singh Tropospheric Composition and Analysis: PAN in Encyclopedia of Atmospheric Sciences, J. Holton, J. Pyle, and J. Curry Eds., Academic Press, London, 2002.
10. D H Ehhalt F Rohrer and A Wahner J. Geophys. Res. 97(1992) 3725
11. J A Logan M J Prather, S C Wofsy and M B McElroy J. Geophys. Res. 86(1981) 7210
12. H B Singh Env. Sci and Technol. 21(1987) 320
13. B J Finlayson-Ptts and J N Pitts ,Jr. Chemistry of the upper and lower atmosphere, Academic Press, London,1999
14. M Lee, B G Heikes, and D W O’Sullivan Atmos. Environ. 34(2000) 3475
15. L Jaeglé, D J Jacob, W H Brune and P O Wennberg Atmos. Environ. 35(2001) 469
16. D W Fahey et al. J. Geophys. Res. 91(1986) 9781
17. Y Kondo et al. J. Geophys. Res. 102(1997) 28,405
18. L K Emmons et al.
Atmos. Environ. 31(1997)1851
19. A N Thakur, et al. Atmos. Environ. 33(1999) 1403
20. J D Bradshaw Rev. Geophys. 38(2000) 61
21. J Roberts Reactive odd nitrogen (NOy) in the Atmospheric Environment, In Composition, Chemistry and Climate of the Atmosphere, Ed. H. B. Singh, Van Nostrand Reinhold Publishers, New York, 1995
22. D D Parrish et
al. J. Geophys. Res. 98(1993) 2927
23. H B Singh et al. J. Geophys. Res. 103(1998) 28,237
24. R W Talbot et al. Geophys.
Res. Lett. 26(1999) 3057
25. J H Crawford et al. J. Geophys. Res. 101(1996) 2053
26. J D Bradshaw et al. Geophys. Res. Lett. 26(1999) 471
27. W L Chameides et
al. J. Geophys. Res. 92(1987) 2131
28. D D Davis et al. J Geophys.Res. 101(1996) 2111
29. D J Jacob et al. J. Geophys. Res. 101(1996) 24,235
30. J H Crawford et al. J. Geophys. Res. 102(1997) 28,447
31. J R Olson et al. J. Geophys. Res. 106(2001) 32,749
32. Y Wang, J A
Logan, and D J Jacob J. Geophys. Res. 103(1998) 10727
33. D R Hauglustaine et al. J. Geophys. Res. 103(1998) 28,291
34. R B Chatfield Geophys. Res. Lett. 21(1994) 2705
35. D L Slusher et al Geophys. Res. Lett. In press (2002)
36. H B Singh and D J Jacob Atmos. Environ 34(2000) 4399
37. B J Heikes et al. J. Geophys. Res., 101(1996) 14741
38. J W Harder, A. Fried, S. Sewell, and B. Henry J. Geophys. Res. 102(1997) 6267
39. L M Cardenas et
al. J. Atmos. Chem. 37(2000) 53
40. D Trapp and C. Serves Atmos. Environ 29(1995) 3239
41. J H Crawford et al. J. Geophys. Res. 104(1999) 16,255
42. L Jaeglé et al. J.
Geophys. Res. 105(2000) 3877
43. C Kelly, P Palmer, R Spurr, R Martin, T Kurosu, D Jacob Geophys. Res. Lett. 27(2000) 8461
44. H B Singh, M Kanakidou, P J Crutzen and D J Jacob Nature 378(1995) 50
45. S A McKeen et al. Geopys. Res. Lett. 24(1997) 3177
46. H B Singh et al. Nature 410(2001) 1078
47. K -H Wohlfrom,
T Hauler, F Arnold, and H B Singh Geophys.
Res. Lett. 26(1999) 2849
48. J. Williams et al. J. Atmos. Chem. 38(2001) 133
49. D C Sprung, et al., J. Geophys. Res. 106(2001) 28,511
50. B Heikes et al. J. Geophys. Res. 106(2001) 32,717
51. G J Frost et al. J. Geophys. Res. 107(2002), 10.1029/2001JD000896
52. R B Chatfield and P.J. Crutzen J. Geophys. Res. 89(1984) 7111
53. M J Prather and D J Jacob Geophys. Res. Lett. 24(1997) 3189
54. Y. Wang et al. J. Geophys. Res. 106(2001) 32,733
55. D J Jacob et al. J. Geophys. Res. 107(2002),
10.1029/2001JD000694
56. D E Heard Atmos. Environ. 32(1998) 801
57. H B Singh Geophys. Res. Lett. 4(1977) 101
58. J E Lovelock Nature 267(1977) 32
59. B R Miller, J Huang, R F Weiss, R G Prinn, and P J Fraser J. Geophys. Res. 103(1998) 13,237
60. C M Spivakovsky et al. J. Geophys. Res. 105(2000) 8931
61. R G Prinn et al. Science 269(1995) 187
62. P M Midgley and A McCulloch Atmos. Environ. 29(1995) 1601
63. S A Montzka, C M Spivakovsky, J H Butler, J W Elkins, L T Lock and D J Mondeel Science 288(2000) 500
64. W B DeMore et al. Chemical kinetics and photochemical data for use in stratospheric modeling, Evaluation No. 12, 1997
65. M J Prather and C
M Spivakovsky J. Geophys. Res. 95(1990) 18,723
66. D R Crosley J. of Atmos. Science 52(1995) 3299
67. M Hausmann, U Brandenburger, T Brauers, and H -P Dorn J. Geophys. Res. 102(1997) 16011
68. A Hofzumahaus et al. J. Atm. Chem. 31(1998) 227
69. T M Hard, L A George and R J O'Brien J. Atmos. Sciences 52(1995) 3354
70. P O Wennberg et al Science 279(1998) 49
71. D Tan et al. J. Geophys. Res. 106(2001) 32,667
72. D J Tanner, F L Eisele, and A Jefferson J. Geophys. Res. 102(1997) 6415
73. D R Crosley J. Geophys. Res. 102(1997) 6495
74. W H Brune et al. Geophys. Res. Lett. 26(1999) 3077
75. M P Krol, P. Jan van Leeuwen, and J Lelieveld J. Geophys. Res. 103(1998) 10,697
76. R G Prinn et al. Science 292(2001) 1882
77. M G Lawrence, P Jöckel, and R von Kuhlmann Atm. Chem. Phys. Discuss. 1(2001) 43
78. P Jöckel, C A M Brenninkmeijer, and P J Crutzen Atm. Chem. Phys. Discuss. 2(2002) 1261
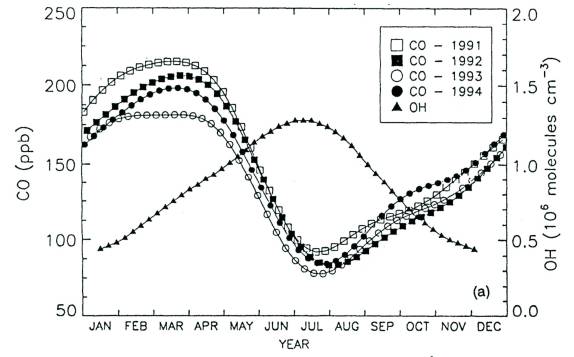
Figure 1: Seasonal cycle of measured mean CO mixing ratios and modeled OH concentrations in the northern hemisphere troposphere. Adapted from Novelli et al. [8]
Figure 2: Typical variation in NOx e-fold lifetime (solid line) and NO2/NOx
ratio (dashed line) with altitude. Adapted from Ehhalt et al. [10]
Figure 3: Reactive nitrogen budget (top panel) and the comparison of measured
NOy with the sum of individual species (NOyI) (bottom
panel) based on observations over the Pacific.
Adapted from Singh et al. [23]
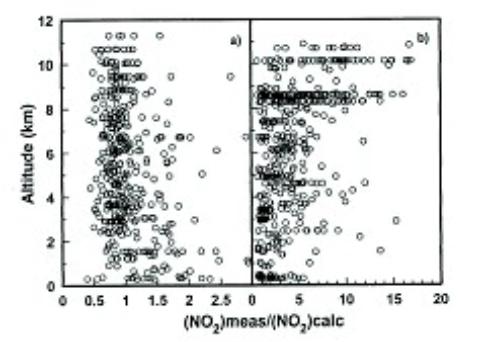
Figure 4: A comparison of the measured NO2 mixing ratios with that calculated from measured NO assuming photostationary state. (a) PEM-Tropics-A/1996 and (b) PEM-West-A/1991. Panel (a) shows the dramatic improvements in results compared to panel (b). Adapted from Bradshaw et al. [26]
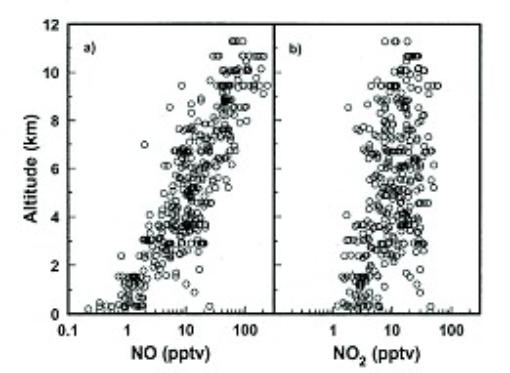
 Figure
5. Altitude distribution of NO and NO2 in the Pacific
troposphere. Adapted from Bradshaw et
al. [26]
Figure
5. Altitude distribution of NO and NO2 in the Pacific
troposphere. Adapted from Bradshaw et
al. [26]
Figure 6. Altitude profile of measured NO within one specific
grid (solid line) and its comparison with results predicted by
three global models (dashed lines). Adapted from Thakur et al. [19]
Figure 7: Altitude profile of oxygenated organic chemicals in the remote Pacific troposphere (0-30˚N). Adapted from Singh et al. [46]
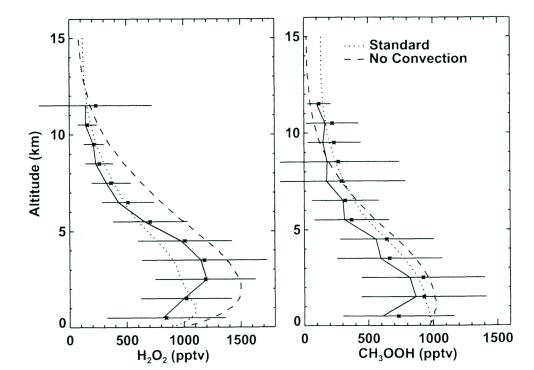
Figure 8: Observed (solid line) and simulated (dashed lines) daytime concentrations of hydrogen peroxide and methyl hydroperoxide. Adapted from Wang et al. [54].
04 06 08 10 12 14 16 18
Time (UT)
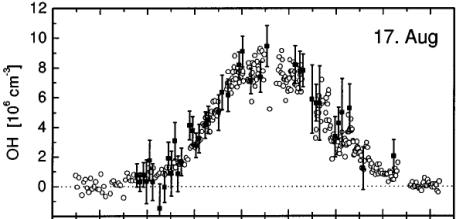
Figure 9: Diurnal behavior of OH as measured by DOAS (solid square)
and LIF (open circle) technique. Adapted from Hofzumahaus et al. [68]
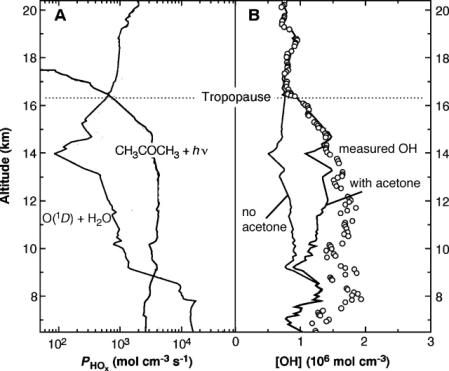
Figure 10: Hydroxyl radical measurement and HOx production in the upper troposphere and lower stratosphere. (A) comparison of HOx production rates from ozone reactions and acetone; (B) comparison of measured and modeled OH with and without the inclusion of acetone. Adapted from Wennberg et al., [70]
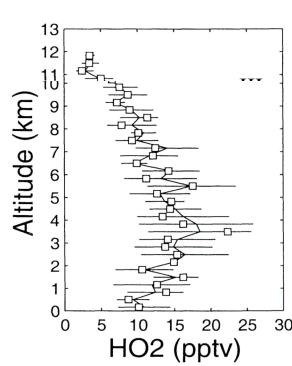
Figure 11: Altitude profile of daytime OH and HO2 mixing ratios in the central south Pacific (region III) troposphere. Adapted from Tan et al. [71]
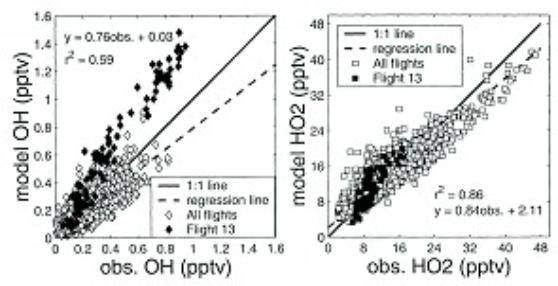
Figure 12: Comparisons of observed and modeled OH and HO2 mixing ratios based on measurements in the Pacific troposphere. Adapted from Tan et al. [71]