Modeling the Tragedy of the Commons

Economic Model of the Tragedy of the Commons
In this lab activity, we will do some experiments with a simple STELLA model that simulates the parable of the tragedy of the commons that involves sheep grazing on a village commons. The basic idea of the model is that there is a village green with nice grass growing on it; the grass is open to everyone with no restrictions — anyone can graze their sheep there. The sheep eat the grass and then convert the grass into milk, which is then sold to cheese makers (this is the main use of sheep where I was living in Italy when I made this model). The money from the sales of milk is then compared to the cost of maintaining and milking the sheep to figure out if there is a net profit or benefit. But the sheep consume the grass, which then has to grow back, and it can only grow back at a certain rate. The grazing area (the commons) has a maximum amount of grass that can possibly exist given the size of the area, so the growth of new grass is dependent on both that upper limit and the amount of grass present at any time. In addition, the amount of grass a sheep consumes is related to how much milk it can produce, so as the grass resource becomes depleted, the sheep will produce less and less milk, which will cut into the profits.
Part A: No Restrictions
In this first model, we'll see what happens as more and more sheep are allowed to graze the commons. Here is what the model looks like:
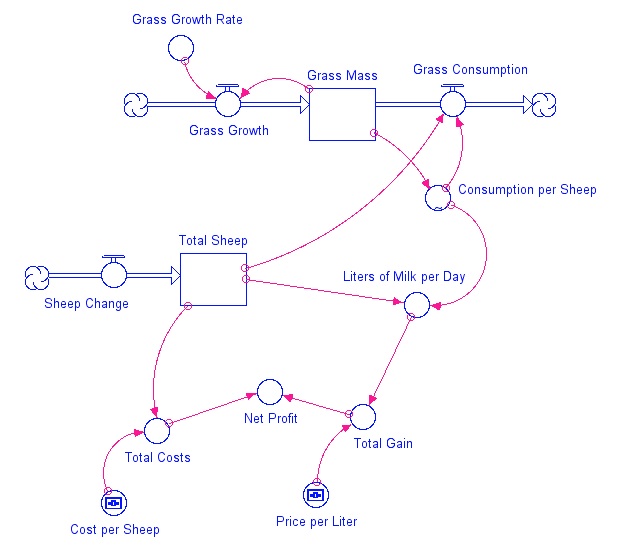
Model diagram showing the economics of sheep grazing and milk production for a case where there are no restrictions on sheep grazing — more sheep are added to the pasture on a regular basis, which affects both the amount of grass remaining in the pasture and the amount of milk produced.
Credit: Dave Bice
We begin with no sheep, and then add one sheep each day. The sheep eat the grass and for every kilogram of grass they eat, they produce 0.4 liters of milk (this is a very rough approximation) which is sold at 10 dollars per liter. The total amount of grass a sheep eats is proportional to how much grass there is — when the grass is at its maximum, each sheep can consume 5 kilograms of grass per day, so each sheep could produce 2 liters of milk per day if the grass was at its maximum. Every sheep costs 0.5 dollars to milk and maintain, and these costs are subtracted from the total gain from selling milk to get the net profit from the whole field.
First, follow this link to the first model. Run the model without changing any of the parameters.
1. What happens to the amount of grass in the commons?
2. What happens to the milk production (Liters of Milk per day)?
3. What happens to the Consumption per Sheep?
4. At what number of sheep is the Net Profit greatest?
5. From an economic standpoint, what is the optimum number of sheep?
Part B: Imposing an Upper Limit — a Cap
Now let's imagine that you are in charge of giving out grazing permits for the village commons and that you want to find the number of sheep that maximizes the profit from the land over the long term. The second model here is very much like the previous model, with the exception that there is a cap, or limit, on the maximum number of sheep. If you set the limit to 50 sheep, then one new sheep will be added each day until 50 is reached, and then the number of sheep will remain constant from then on.
With this model, the graphs on pages 4 and 5 are called comparative graphs — they show one parameter (like Net Profit) for a number of different runs. You can run the model multiple times with different limits on the number of sheep and it will show the Net Profit from all of those runs on the same graph page, allowing you to make a choice about which limit is the most desirable. The Clear Graphs button on the lower right will erase the graphs and let you start over with a blank graph.
6. What number of sheep results in the highest steady net profit over the long term? You're looking for a number that results in a steady state, with constant values of profit and grass abundance after the specified sheep limit has been reached.
Part C: Responding to Profits
Now we explore a case where there is no outside manager setting a limit on the sheep, but you as the farmer control the addition of new sheep based on your profits. If your profits for one day are greater than the previous day, then things are looking good and you add another sheep. But if the profits are lower than the previous day, you do not add any more sheep. Follow this link to the third model, and run it without making any changes.
7. Does this management strategy lead to a stable, sustainable system?
8. How does the maximum number of sheep here compare with your optimum number from question 6 (the previous model)?
9. Does the profit-based management lead to greater, lesser, or equal net profits (in the steady state) compared to the model where the optimum number of sheep was found through experimentation (question 6)?
Part D: Discounting the Total Profits
Now we will treat this little economic model to an analysis like that applied to the DICE model, by summing the profits over time and subjecting them to a discounting scheme. We do this by adding some new reservoirs that will effectively just sum up quantities from the earlier model. Here is what the model looks like:
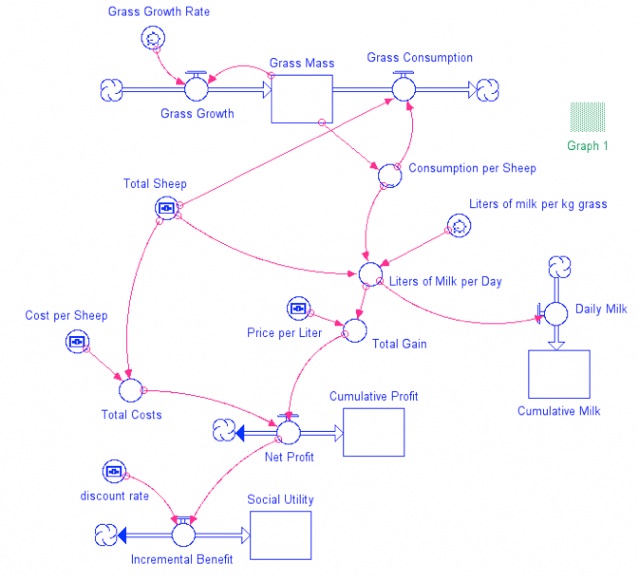
Model diagram showing the economics of sheep grazing and milk production for a case wher the number of sheep grazing is controlled by the user. This model takes the net profits from each day and sums them to give the cumulative profit; it does the same for milk production to give cumulative milk produced. The model includes a discount rate, that combines with the daily net profits to give the incremental discounted benefit, which then accumulates to provide an overall measure of what is called the social utility. The discounting scheme is typical of economic models that seek to place future profits into terms relative to the present time; it is based on an assumption that the overall economy will grow over time such that one dollar today is equivalent to more than one dollar in the future -- the discount rate determines precisely how much more it is worth. .
Credit: Dave Bice
Here, Net Profit is a flow that feeds into Cumulative Profit, which is just the sum of all the profits over time. The Net Profit at each moment in time then feeds into something called Incremental Benefit, which is where the discount rate comes into play. The discount rate is a percentage by which future profits are discounted so that the profits through time are all comparable to the present time. For example, a profit of 1000 dollars 50 years from now, with a discount rate of 4%, becomes:
1000*(1+0.04)-50 which is about 140
In other words, with a 4% discount rate, that 1000 dollar profit 50 years from now is worth only 140 dollars in today's world. You can turn this around and say that 140 dollars today, growing at an annual rate of 4%, turns into 1000 dollars 50 years from now. If the discount rate is 0%, then 1000 dollars in the future is 1000 dollars in the present world. The discount rate then allows us to compare the future with the present. Many economists use the 4% figure (plus or minus a bit) as a typical discount rate, but if you think about it, this assumes that the economy will grow at that 4% rate. In this little model, however, the resource upon which the whole economic enterprise is based — the grass — has a finite area and a maximum mass and a limited growth rate, so there are clearly some limits to the economic outputs from this grass. In other words, this notion of a discount rate is based on some assumptions about unlimited growth that may not always be reasonable.
The Incremental Benefit then feeds into a reservoir I call Social Utility, which sums up the Incremental Benefit over time. The term Social Utility is used here because it is the same term that Nordhaus uses in the DICE model that we will look at in Lab 2. The idea then, is that a model with the highest ending Social Utility value is the best one in purely economic terms.
Now we're ready to play with this model a bit. Follow this link to the fourth model. In this model, you choose a number of sheep that remain constant over the model run; you also choose a discount rate (there are other parameters to change, but we'll leave these alone to keep things simpler). Graph page 6 shows the Social Utility reservoir value in a comparative plot that will allow you to compare the results of choosing different numbers of sheep or different discount rates.
10. With the discount rate at 4%, what number of sheep gives the greatest Social Utility? (This number would be the optimum number from an economic standpoint.) How does this number compare with the number of sheep that gives the greatest Cumulative Profit?
11. Now change the discount rate to 10% and find the optimum number of sheep based on Social Utility. With this number of sheep, what is the milk production in terms of liters per day after 75 days? Is this a sustainable model?
12. Now, ignore the discount rate and find the optimum number of sheep in terms not of profit, but of cumulative amount of milk from the commons.
13. If you want a sustainable system, is it better to follow a model that uses a discount rate on profits, or one based on finding the optimum steady state in terms of resources (i.e., grass) and products (i.e., milk)?