Experiments with a modified planetary climate model

Now we’re ready to try something more challenging and more realistic. In the real world, the surface temperature has a big impact on the albedo — when it gets very cold, snow and ice will form and increase the albedo. So there is a feedback in the system — a temperature change will cause an albedo change. To add this feedback, we need to work with an altered version of the model (click here), where a connector arrow has been added from Temperature to Albedo and then we define Albedo as a graphical function of Temperature as follows:
Experiment 6 — Adding a Feedback
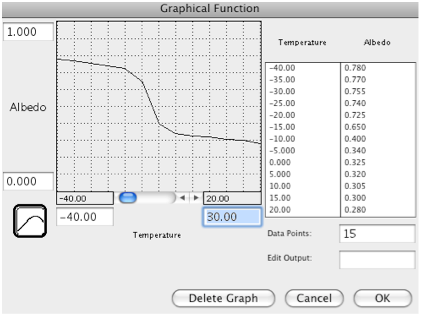
This graph implies that there is a kind of threshold temperature of about -10 °C at which point the whole planet becomes frozen. The suggestion is that even with a very cold global temperature of 0 °C, the equatorial region might be relatively ice-free and would thus have a low albedo, but as the temperature gets colder, even the tropics become covered by snow and ice. Once that happens, the planetary albedo changes only slightly. Likewise, at higher temperatures, the albedo decreases only slightly since there is so little snow and ice to remove.
It is important to understand what this model includes — a link between planetary temperature and planetary albedo. As the temperature changes, so the albedo changes, and as the albedo changes, so the insolation changes, and as the insolation changes, so the temperature changes — this is a feedback mechanism. Feedback mechanisms are very important components of many systems, and our climate system is full of them.
Let’s see what this one does. By definition, feedback mechanisms are triggered by a change in a system — if it is in steady state, the feedbacks may not do much. In the above graph, you may notice that at a temperature of 15°C (our steady state temperature), the albedo is 0.3, which is the albedo of our steady state model. So, if we run the model with an initial temperature of 15 °C, and an unchanging solar constant of 1370, our system will be in a steady state and we will not see the consequences of this feedback. But, if we impose a change on the system, things will happen.
The model comes with the Solar Constant set to increase and then decrease in a rather extreme way — this will trigger the feedback mechanism. The model actually consists of two nearly identical versions — the only difference is in the way albedo is define. In one, it is a function of temperature as described above, and in the other it is a constant value of 0.3
6a. Run the model and describe in a couple of sentences how (not why) the temperature of model 1 (with the feedback mechanism) compares to the temperature of model 2 (with constant albedo) — pay attention to where they differ and where they are similar.
6b. Now, explain why the 2 models are so different during part of the time and so similar during other parts of the model run. Your answer should take into account the graphs of the albedo over time and the flux in and flux out for each model. The flux in and out are measures of the of energy flow divided by the surface area, with units of W/m2.
6c. Model 1 obviously gets very cold and represents what is called a Snowball condition. What is the solar input level at which the rapid transition into the Snowball occurs? How high does the solar input need to be to get the Earth out of the Snowball condition?