Pennsylvania Energy Proposal
Deborah Feder
Vince Calvano
Steve Kardohely
Nate Herman
In Pennsylvania, energy is a 'necessity.' It furnishes a high standard of living, and provides power for heating, cooking, lighting, cooling, appliances, and manufacturing, as well as a myriad of other residential, commercial, and industrial purposes. Traditionally energy has been supplied by fossil fuels and fossil fuel/nuclear electricity, while renewable energy forms have only made modest contributions to the United States supply mix. This reliance on fossil fuels and electricity has had major social, economic, environmental, and political implications. For example, the need for petroleum has involved the United States in trade disputes such as the OPEC embargo, wars such as the Persian Gulf War, and environmental issues such as the Exxon Valdez oil spill. The continual use of cola has contributed to global warming while reliance on nuclear electricity has created problems of radioactive waste disposal. In addition, the continued dependence on fossil fuels and electricity has created scarcity because more energy resources are being used to generate energy than are necessary to provide particular end-use services. For every three units of energy utilized to create electricity, only about one unit actually reaches the end user. Two units are essentially lost since they are released into the environment as pollution, and create further scarcity of resources. Therefore, it is contended that reliance on fossil fuels and fossil fuel/nuclear electricity is no t sustainable. There are many alternative renewable energy forms that can be used for end-uses such as space heating, water heating, irrigation, and water pumping that are more environmentally benign, economically and politically more sustainable, and do not compromise the deliver of end-use services.
This section demonstrates the need for change in Pennsylvania's residential energy sector since residential energy consumption accounts for a significant proportion of Pa energy use. It will explain why matching energy sources to end-uses is the appropriate measuring stick for energy use. It will then call on this logic as it draws from DOE data and other discourse to rationalize certain trends in Pa energy consumption. It will compare residential energy consumption at four different scales, at the national, regional, state, and county-levels. Beginning at the state level, Pa, which ranks sixth in the nation for residential energy consumption will be analyzed, and the county level energy use in Centre County will be highlighted. At the regional level, energy use in the Mid-Atlantic, comprised of New York, Pa, and New Jersey, will be analyzed since this region accounts for 14% of the nation's residential energy use. The paper will also uncover competition with the connected politics between states surrounding Pa and will show that ………… Finally a local energy audit and interviews that were conducted will serve as less abstract evidence that Pa needs to change its residential energy habits. Such an examination into all of these areas will bring attention to factors that reify fossil fuels and electricity as primary energy sources. It is thought that having a good understanding of these factors is the cornerstone for assessing where renewable energies can make potential in-roads in the residential sector in the next millennium.
Matching Sources to End-Uses
In society, energy forms are paired with end-uses to provide energy services. The laws of thermodynamics can be used to explain this matching process. They suggest that energy has two properties, quantity and quality, which impact the efficiency of energy conversion from source to end-use. The first law of thermodynamics states that matter and energy can not be created, consumed, or destroyed. The amount in the universe is constant. Energy is transformed from one form to another, and the amount lost from one state is always equivalent to the energy gained by its surroundings. Therefore, the first law of thermodynamics measures energy quantity. It is calculated by dividing the amount of energy output by the amount of energy input. So if an oil furnace produces 65,000Btu of useful space heat from 100,000 Btu of heating oil, the first law efficiency is 65%. Note that no energy conversion is 100% efficient, and that energy not used for the end-use task is dissipated into the environment as pollution. Rifkin (1980: 35) suggests, "Many people think pollution is a byproduct of production. In fact, pollution is the sum total of all the available energy in the world that has been transformed into unavailable energy. Waste is dissipated energy." The first law of thermodynamics does not distinguish between heat, waste, emissions, pollution, and work. They are all considered equivalent energy forms, with no quantitative distinction. Despite this seeming equity, all energy forms are not the same. There are qualitative distinctions between various forms. The second law of thermodynamics takes up this distinction.
The second law of thermodynamics or the entropy law emphasizes energy quality. Energy quality is related to the energy's temperature above the ambient environment. Since various energies and fuels generate heat at various temperatures, some energies and fuels have greater ability to do work, even if they produce the same about of heat. Different energy forms have different qualities, meaning that particular sources are more suited for particular tasks, and create less byproducts during energy conversion processes. High-quality energies include electricity, coal, natural gas, nuclear, and petroleum, whereas low-quality energies include heat and solar thermal. When energy is converted to do work, its quality irreversibly degrades. High-quality energy is transformed into lower-quality energy. Georgescu-Roegen compares this transformation to the shuffling of playing cards, the beating of an egg, and the devastation of a library by an unruly mob. He suggests that, "Nothing is destroyed (the first law of thermodynamics), but everything is scattered to the four winds . . . In nature there is a constant tendency for order to turn into disorder." (1971: 142)
To minimize this disorder, it is necessary to match appropriate energy sources with end-uses based on quantity and quality. For any given activity, there are multiple energy sources that can be used to provide an end-use service. For example, home heating can be furnished with natural gas, electricity, coal, or solar thermal. The selection of heating source impacts the amount of energy used as well as pollution and scarcity created. Therefore, all sources are not equal even though there may be numerous sources for each end-use activity.
Table 1 shows the usefulness of different energy forms. Electricity is the highest quality source and freezing cold is the lowest quality source. High-quality sources can be matched with any end-use activity that falls below it on Table 1, however by not matching energy quality with its usefulness, unnecessary scarcity and pollution are created. While Table 2 illustrates how end-uses, such as space heating, can be satisfied with multiple energy sources: natural gas, coal-electric, or solar thermal. Natural gas and coal-electric are high-quality sources and solar thermal is a low-quality source. Therefore, the selecting of energy source has different implications on ecological degradation and scarcity. The next section will examine how mismatched energy sources and end-uses create ecological degradation and scarcity.
Mismatched Energy Sources and Ecological Degradation
When high quality energy sources are used for tasks, such as space heating (see Table 2) that do not require their extra quality, the extra quality or unused energy is released into the environment, creating ecological degradation. Ecological degradation can come in many forms. It can be radioactive waste, water pollution, air pollution, contribute to global warming, amount other ecological problems. Of these problems, global warming was the primary concern for this class. The residential sector contributes to the United States greenhouse gas budget by using high-quality energy sources for many end-uses that could be satisfied with renewable energy source or low-quality heat. In 1996, the residential electricity use emitted approximately 181 million metric tons of carbon into the atmosphere. Other contributors included natural gas and petroleum. The reason why coal is not a major contributor to the residential sector's greenhouse gas emissions is because it is not widely used fuel in this sector. Figure 1 illustrates carbon dioxide emissions from the residential sector and demonstrates how ubiquitous reliance on electricity and fossil fuels can lead to serious environmental problems.
Scarcity
Scarcity is another implication of using energy sources that are not matched in quality to a particular end-use. Scarcity occurs when there is more demand for a source than supply. According to neoclassical economics, it occurs because there are fixed resources and unlimited wants. However, it is argued that the notion of fixed resources and unlimited human wants is a social construction. Resources are defined within the nexus of relations and wants are defined within society. For example, in the 1940s coal was considered a primary energy resource, however starting in the 1960s environmental discourses pertaining to air and water pollution made coal an unpopular source. Its use was largely replaced by natural gas and oil which did not cause as much ecological degradation. Moreover, wants are temporal and variable. The need for computers and all kinds of electronic gadgets is not an inherent condition within humans, but rather constructed within society. Therefore, it is argued that scarcity occurs when demand outstrips available supply. Thus, scarcity is constructed by two events in society: a contraction of supply which occurs when renewable energy sources are not emphasized or precluded from energy mixes and an expansion in demand which occurs when particular non-renewable energy sources are used for multiple end-uses.
Residential Energy Use in Pennsylvania
In Pennsylvania, there was even greater reliance on coal than in the United States and the Mid-Atlantic. In the 1940s, coal accounted for 85% of energy use. Its prominence precluded the large-scale use of other sources. Gas, oil, and wood all were used in quantities that were less than 5% of total energy use. Their proportion of Pennsylvania’s energy mix would grow after the 1940s, when reliance on coal shrank considerably (See Figure 6). In 1950, coal accounted for 60% of residential energy use, in 1960 in accounted for 30%, in 1970 for 10%, and in 1980 and 1990 less than 5%. Therefore, coal played an important, yet diminishing role in Pennsylvania’s residential energy landscape. Its contraction allowed the use of oil and gas to expand in the 1950s and 1960s. In 1960, gas use surpassed coal use for the first time. Gas amounted to 35% of Pennsylvania’s supply mix and oil amounted to 31% (See Figure 6). As coal use continued to contract over time, reliance on gas and oil further expanded. However by 1970 and 1980, gas and oil use had reached their peak, and electricity inched its way upward as an energy source. In 1970, electricity accounted for 3% of Pennsylvania’s energy use, in 1980 it accounted for 10%, and in 1990 it accounted for 15%. Despite electricity’s growth, it remained a secondary energy source compared to gas and oil (see Figure 6).
Pennsylvania’s reliance on gas is consistent with national and regional trends. However its adherence to oil differs from the national and regional scales, where oil plays a less prominent role. This shows that gas and oil are Pennsylvania’s primary residential energy sources, whereas oil plays a smaller role in other parts of the country. For renewable energies to be embraced in the residential sector in Pennsylvania, they will have to become competitive with gas and oil in terms of price, ease of use, reliability, and flexibility.
Nevertheless, Pennsylvania’s forty year residential energy history illustrates how their substitution is possible. In the future, gas and oil may contract being replaced by more benign renewable energies that minimize scarcity and degradation. However, that will only happen when renewable energies are perceived as viable residential energy resources.
Residential Energy use in Centre County
To evaluate associations between particular energy sources in Centre County, a factor analysis model was run of home heating fuels for 1990. When electricity, coal, natural gas, solar, wood, LPG, and oil were loaded into the model, two factors emerged: a modern fossil fuel factor and a renewable coal factor (see Map 1).
Map
Electricity, LPG, gas, and oil were loaded high on facto 1 and low on factor 2 and coal, solar, and wood were loaded high on factor 2 and low on factor 1. This means that fossil fuels energy sources tend to cluster together and renewable sources tend to cluster together in use. Coal is associated with renewables because it is not a widely used energy source (see Figure 6) in the state of Pennsylvania. This statistical map shows that fossil fuels are widely used in Centre County and coal, solar, and wood are not. The rotated component matrix for the model is given below. Not the high loadings for the fuels associated with factor 1 and the low loadings for the energies associated with factor 2. Coal is the least well-explained energy form by this model, however 76% of the variance is explained.
Chart
Residential Energy use in the Mid-Atlantic
As was the case for the rest of the nation, in 1940, coal use
dominated residential energy consumption the Mid-Atlantic. It accounted for 78% of energy use, and was
a larger proportion of the Midt proportion, yet steep decline from 1940. Its contraction was compensated for by the
growth in gas and oil that grew to be 15% and 30% of the Mid-Atlantic’s energy
mix respectively. This contraction of
coal and expansion of oil and gas was consisent with national
Pennsylvania’s Unique Climate Characteristics
Like all of the states in the Mid-Atlantic region, Pennsylvania’s general climate scheme is humid continental. The changeable nature of weather in all seasons is a characteristic feature of this climate with ample precipitation varying from 50cm to 120cm distributed evenly throughout the year. Rainfall provides water for a multitude of plush broadleaf forests, meadows, and wetlands that account for Pennsylvania’s ecosystems. Pennsylvania natives enjoy four distinct seasons are evenly spaced throughout the year with a typical growing season of 130 to 165 days per year.
Yearly Average Precipitation
 ©1999
World Book Online
©1999
World Book Online
NY: 13.66; 49
MD: 8.44; 33
OH: 8.7; 36
NJ: 11.39; 44
WV: 6.29; 6
CA: 10.6; 42
NY, NJ, CA all pays more, OH, MD, WV all pay less. All are marginal differences with the exception of WV who is a net exporter and uses an extraordinary amount of coal.
Each person in Pennsylvania consumes 15.92mW. This figure ranks Pennsylvania 21 in the nation. An important adjustment needs to be made because residential energy consumption accounts for only 1/3 of the total energy consumed in the state. 2/3 are due to commercial and industrial so residential use 5.31 mW per person. With the same adjustment made for the other states
NY: 3.32
MD: 3.29
OH: 4.39
NJ: 2.21
WV: 17.08
CA: 1.93
Energy consumed per capita from least to greatest is: CA, NJ, MD, NY, OH, PA, WV (DOE, 1998)
There is no evidence that marginal price differences have a large effect on how much energy is consumed per capita, however, there are two interesting observations. WV, pays extremely low prices, uses extremely high amounts of electricity. If we assume that WV uses excessive energy because it is so cheap, and it is so cheap because it is heavily subsidized, this suggests that one of the worst things Pennsylvania can do is to subsidize energy to the point that it is very cheap if it wants to use less energy. Intuition tells us that less subsidizing energy will result in higher prices and less consumption, but there is no good example of this principle with the data examined here.
Also, California pays only a little bit more for energy, 10.6 cents in comparison to 9.96 cents for Pennsylvania, and yet it uses much less energy, 73.3% less energy in its homes. Part of this may be the warmer temperatures, but presumably much of it is due to the public perception and goal of being a clean state.
If California’s numbers may be tainted by it’s climate, certainly New Jersey who is in the same region as Pennsylvania will give a more accurate comparison. New Jersey, known as being the garbage dumping state pays a little more than California at 11.4 cents and uses 70% less residential energy than Pennsylvania by a long shot.
We can draw from these examples that price isn’t necessarily the bottom line for energy consumption in the home. It could be ethical goals towards consuming less as in the case of proud Californians.
Proposal for Coal Use
Coal by far the most widely used utility fuel in Pennsylvania, and the dirtiest. The following is a rational plan for reducing carbon dioxide emissions, keeping prices low and providing energy for years to come in Pennsylvania.
At first glance, there are a few different options that Pennsylvania can choose from. The government can increase coal-based electricity prices any number of different ways: withdraw subsidies, enforce stricter clean air guidelines. Coercion is often not a viable option because there is much resistance from utilities. Secondly voters won’t support a candidate who will “raise prices” on them.
A second option is to use the free market as a way of forcing coal companies to start switching over to 2nd generation clean-coal technologies. This is the option we think is most suitable because most of Pennsylvania’s plants will need replaced within ten years, and so that is a better guarantee for change than politicians. That is not to say that the government can’t help out in certain respects.
The typical cycle for a Pennsylvania coal power plant is 35% efficient. That is to say that for every 100 Btu’s of chemical energy released when coal combusts, there will be 35 Btu’s of electricity produced. With improvements made in turbine design and control systems, the most efficient steam turbine coal furnaces are 39% efficient (DOE).
An important rule of thumb is that a 1% rise in efficiency results in a 1.14% drop in overall CO2 emissions. For example, the 4% increase in efficiency with the improved turbine and controls results in 4*1.14%=4.56% drop in overall CO2 emissions (Denny, 13). This is significant when considering the massive amounts of CO2 released, 129,324 Thousand Short Tons in Pennsylvania in 1998. A difference of 5,987 TSS/year would be realized with a simple retrofit or installation of these new turbines and control systems.
There have been changes in much more than turbine and control designs that boost efficiencies to even greater levels. 2nd generation clean coal technologies with efficiencies of greater than 50% are presently either commercially available or under development. A variety of configurations were researched and a decision was made as to which would be the most suitable. The four units under serious consideration were:
Atmospheric Fluidized-Bed Combustion
Pressurized Fluidized Bed Combustion
Integrated Gasification Combined Cycle
Indirect Fired Cycles
The decision an eventual replacement of all of Pennsylvania’s plants with the Integrated Gasification Combined Cycle (IGCC). The decision was IGCC because relative to the other three choices it has a higher efficiency of 52%. It has the lowest Sox, Nox, and CO2 emissions. Capital costs will be reduced by 2008 to 1,000$/kwh. Being the most versatile, it uses clean synthesis gas from any number of carbon-based fuels, coal, biomass, municipal waste, petroleum. These gases are combusted and used to drive a gas turbine, the heat from the flu gas is utilized through a heat exchanger to produce steam which drives a steam turbine. The opportunity also exists for using the excess heat to heat buildings or even a nearby town (DOE). Perhaps the biggest factor is the physical construction. According to the report Global Changes in Local Places, “IGCC systems are easier to construct in phases,” and this means, “Modular construction would allow the remainder of the plant to keep running while the new technology is built (Denny, 17).” This advantage is extremely important because it makes it possible for utilities to afford switching to a new IGCC unit.
In Global Changes in Local Places, a case study of central of five counties in central Pennsylvania including Centre county concluded that replacing the two power plants within the region with if IGCC’s were to replace the Shawville and Sunbury coal power plants increased efficiency would bring these five counties 39-62% closer to meeting Kyoto protocol in 2010 (7% below 1990 levels). Conservation and energy matching in the residential sector could easily take a large chunk out of the remaining 38-61% (Denny, 18).
Proportionally, the rest of Pennsylvania uses less than this five county area but a calculation can be made to estimate the cut in CO2 after a changeover. If we replaced all of Pa’s power plants eventually with IGCC plants, there would be an approximate 14% decrease in CO2 emissions of statewide CO2 emissions reducing 130,000 short tons/year to 112,000 CO2. This brings Pennsylvania 85.7% closer to 1990 emissions (109,000 short tons/year). When the time comes and after it is fully developed the IGCC will be the primary choice for 2nd generation coal power in Pennsylvania.
Proposal for Use of Renewables
Pennsylvania relies heavily on fossil fuel combustion, especially that based on oil and coal, which are major contributors to increasing green house gas concentrations (mainly in the form of CO2) in the atmosphere, that are linked to global warming. This climate change, according to Pimentel et al., is considered one of the most serious environmental threats throughout the world because of its potential impact on food production and processes vital to a productive environment. Therefore, concerns about carbon dioxide and other green house gas emissions may discourage dependence on coal use and encourage the development and use of renewable energy technologies.
Population growth is expected to speed fossil energy depletion and intensify global warming even if the rate of increase of per capita fossil energy consumption is slowed by conservation measures. Therefore, the projected availability of all fossil energy reserves probably has been overstated (Pimentel et al. 1994). Substantially reducing PA use of fossil fuels through the efficient use of energy and the adoption of renewable energy technologies will extend the life of fossil fuel resources and could provide the time needed to develop and improve renewable energy technologies.
The rapid depletion of US oil and gas reserves is expected to necessitate increased use of coal (Pimentel et al. 1994), which would have to be true for Pennsylvania as well. How rapidly the coal supply is depleted will depend on energy consumption rates for both the US and PA. Undoubtedly, new technologies will be developed that will make it possible to extract more oil and coal. However, this extra extraction can only be achieved at greater energy and economic costs. When the energy input needed to power these methods approaches the amount of energy mined, extraction will no longer be energy cost-effective (Hall et al. 1986).
In this section, I will analyze the potential of various renewable energy technologies that can be used to supply the Pennsylvania with its future energy needs. Renewable energy technologies that have the potential to provide future energy supplies include: biomass systems, hydroelectric systems, hydrogen fuel, wind power, photovoltaics, solar thermal systems, and passive and active heating and cooling systems. This report will focus on biomass systems, hydrogen fuel, and wind power. Two case studies of Green Mountain wind and solar power plants are already showing their potential in PA to decrease the demand on fossil fuels.
Biomass energy systems
In the future most biomass probably will be used for space and water heating, but in order to clarify the comparison with other renewable technologies, a conversion into electricity units is necessary. An average of 3 tons of (dry) woody biomass can be sustainably harvested per hectare per year with small amounts of nutrient fertilizer inputs (Birdsey 1992). This amount of woody biomass has a gross energy yield of 53.5 million BTU. The net yield is, however, lower because approximately 33 liters of diesel fuel oil per hectare is expended for cutting and collecting wood and for transportation, assuming an 80 kilometer roundtrip between the forest and the plant. The economic benefits of biomass are maximized when biomass can be used close to where it is harvested (Pimentel et al., 1994).
A city of 100,000 people using the biomass from a sustainable forest (3 tons/ha) for fuel would require approximately 220,000 ha of forest area, based on an electrical demand of 1 billion kWh (860 x 109 kcal = 1 kWh) per year (Pimentel et al. 1994). Nearly 70% of the heat energy produced from burning biomass is lost in the conversion into electricity, similar to losses experienced in coal-fired plants. The area required is about the same as that currently used by 100,000 people for food production, housing, industry, and roadways (USDA 1992).
The cost of producing a kilowatt of electricity from woody biomass ranges from 7¢ to 10¢, which is competitive for electricity production that presently has a cost ranging from 3¢ to 13¢ (USBC 1992a). Approximately 12 BTU of thermal energy is required to produce 0.00349 kWh of electricity. According to Pimentel et al., biomass could supply the nation with 5 quads of its total gross energy supply by the year 2050 with the use of at least 75 million ha (an area larger than Texas, or approximately 8% of the 917 million ha in the United States) (1994). Given that there are 15 million acres of forestland, and 7.1 million acres of farm land (22.1 million acres or 8.9 million ha) in PA, and assuming that 25% of that land (2.25 million ha) could be used for biomass generation by the year 2050, biomass could supply PA with 0.1483 quads of its total gross energy supply.
There are several factors that limit reliance on woody biomass. Culturing fast-growing trees in a plantation system located on prime land might increase yields of woody biomass. However, this practice is unrealistic because prime land is essential for food production. Furthermore, such intensely managed systems require additional fossil fuel inputs for heavy machinery, fertilizers, and pesticides, thereby diminishing the net energy available. In addition, Hall et al. (1986) point out that energy is not the highest priority use of trees.
The use of biomass energy produces many negative environmental effects. Losses in of biodiversity can be expected if natural forests are managed for maximal biomass energy production. Also, the conversion of natural forests into plantations increases soil erosion and water runoff. Continuous soil erosion and degradation would ultimately reduce the overall productivity of the land. Despite serious limitations of plantations, biomass production could be increased using agroforestry technologies designed to protect soil quality and conserve biodiversity. In these systems, the energy and economic costs would be significant and therefore might limit the use of this strategy (Pimentel et al. 1994).
Even though the burning of biomass is environmentally more polluting than gas it is still less polluting than coal. Biomass combustion releases more than 100 different chemical pollutants into the atmosphere (Alfheim and Ramdahl 1986). Wood smoke is reported to contain pollutants known to cause bronchitis, emphysema, and other illnesses. Of special concern are the relatively high concentrations of potentially carcinogenic polycyclic aromatic hydrocarbons (PAHs, organic compounds such as benzopyrene) and particulates found in biomass smoke (DOE 1980). Sulfur and nitrogen oxides, carbon monoxide, and aldehydes also are released in small though significant quantities and contribute to reduced air quality (DOE 1980). In electric generating plants, however, as much as 70% of these air pollutants can be removed by installing the appropriate air-pollution control devices in the combustion system (Pimentel et al. 1994).
Because of pollutants, several communities (including Aspen, Colorado) have banned the burning of wood for heating homes. When biomass is burned continuously in the home for heating, its pollutants can be a threat to human health (Lipfert et al. 1988, Smith 1987b).
When biomass in the form of harvested crop residues is used for fuel, the soil is exposed to intense erosion by wind and water (Pimentel et al. 1984). In addition to the serious degradation of valuable agricultural land, the practice of burning crop residues as a fuel removes essential nutrients from the land and requires the application of costly fossil-based fertilizers if yields are to be maintained. However, the soil organic matter, soil biota, and water-holding capacity of the soil cannot be replaced by applying fertilizers. Therefore, crop residues should not be removed from the land for a fuel source (Pimentel 1992).
Biomass will continue to be a valuable renewable energy resource in the future, but its expansion will be greatly limited. Its use conflicts with the needs of agricultural and forestry production and contributes to major environmental problems (Pimentel et al. 1994).
Biofuels
Ethanol has been proposed as an alternative fuel to reduce our demand for petroleum, however studies have shown that ethanol production is not a sustainable choice to replace petroleum. For example, any benefits from ethanol production, including the corn by-products, are negated by the environmental pollution costs incurred from ethanol production (Pimentel 1991). Intensive corn production in the United States causes serious soil erosion and also requires the further drawdown of groundwater resources. Another environmental problem is caused by the large quantity of stillage or effluent produced. During the fermentation process approximately 13 liters of sewage effluent is produced and placed in the sewage system for each liter of ethanol produced.
Although ethanol has been advertised as reducing air pollution when mixed with gasoline or burned as the only fuel, there is no reduction when the entire production system is considered. Ethanol does release less carbon monoxide and sulfur oxides than gasoline and diesel fuels. However, nitrogen oxides, formaldehydes, other aldehydes, and alcohol--all serious air pollutants-- are associated with the burning of ethanol as fuel mixture with or without gasoline (Sillman and Samson 1990). Also, the production and use of ethanol fuel contribute to the increase in atmospheric carbon dioxide and to global warming, because twice as much fossil fuel energy is burned in ethanol production than is produced as ethanol. Ethanol produced from corn is clearly not a renewable energy source (Pimentel et al. 1994).
If methanol from biomass was used to replace oil, there would not be enough available crop land to supply the raw material needed to replace oil (Pimentel et al. 1994). Compared to gasoline and diesel fuel, both methanol and ethanol reduce the amount of carbon monoxide and sulfur oxide pollutants produced, however both contribute other major air pollutants such as aldehydes and alcohol. Air pollutants from these fuels worsen the tropospheric ozone problem because of the emissions of nitrogen oxides from the richer mixtures used in the combustion engines (Sillman and Samson 1990).
Analyses by Pimentel et al. (1994) show that gaseous hydrogen, produced by the electrolysis of water, is another alternative to petroleum fuels. Using solar electric technologies for its production, hydrogen has the potential to serve as a renewable gaseous and liquid fuel for transportation vehicles. In addition hydrogen can be used as an energy storage system for electrical solar energy technologies, like photovoltaics (Winter and Nitsch 1988).
The material inputs for a hydrogen production facility are primarily those needed to build a solar electric production facility. The energy required to produce 1 billion kWh of hydrogen is 1.3 billion kWh of electricity (Voigt 1984). If current photovoltaics require 2700 ha/1 billion kWh, then a total area of 3510 ha would be needed to supply the equivalent of 1 billion kWh of hydrogen fuel. Based on US per capita liquid fuel needs, a facility covering approximately 0.15 ha (16,300 ft2) would be needed to produce a year's requirement of liquid hydrogen. In such a facility, the water requirement for electrolytic production of 1 billion kWh/yr equivalent of hydrogen is approximately 300 million liters/yr (Voigt 1984).
To consider hydrogen as a substitute for gasoline: 9.5 kg of hydrogen produces energy equivalent to that produced by 25 kg of gasoline. Storing 25 kg of gasoline requires a tank with a mass of 17 kg, whereas the storage of 9.5 kg of hydrogen requires 55 kg (Peschka 1987). Part of the reason for this difference is that the volume of hydrogen fuel is about four times greater than that for the same energy content of gasoline. Although the hydrogen storage vessel is large, hydrogen burns 1.33 times more efficiently than gasoline in automobiles (Bockris and Wass 1988). In tests, a BMW 745i liquid hydrogen test vehicle with a tank weight of 75 kg, and the energy equivalent of 40 liters (320,000 kcal) of gasoline, had a cruising range in traffic of 400 km or a fuel efficiency of 10 km per liter (24 mpg) (Winter 1986).
At present, commercial hydrogen is more expensive than gasoline. For example, assuming 5¢ per kWh of electricity from a conventional power plant, hydrogen would cost 9¢ per kWh (Bockris and Wass 1988). This cost is the equivalent of 67¢/liter ($2.77/gallon) of gasoline. Gasoline sells at the pump in the United States for approximately 30¢/liter ($1.14/gallon) (Pimentel et al. 1994). However, estimates are that the real cost of burning a liter of gasoline ranges from $1.06 to $1.32 ($4.01 to $5.00/gallon), when production, pollution, and other external costs are included (Worldwatch Institute 1989). Therefore, based on these calculations hydrogen fuel may eventually be competitive.
Some of the oxygen gas produced during the electrolysis of water can be used to offset the cost of hydrogen. Also, the oxygen can be combined with hydrogen in a fuel cell. Hydrogen fuel cells used in rural and suburban areas as electricity sources could help decentralize the power grid, allowing central power facilities to decrease output, save transmission costs, and make mass-produced, economical energy available to industry. The environmental impacts of hydrogen are minimal. The negative impacts that occur during production are all associated with the solar electric technology used in production.
Water for the production of hydrogen may be a problem in the arid regions of the United States, but the amount required is relatively small compared with the demand for irrigation water in agriculture, and Pennsylvania has a relatively abundant supply of water, so this problem should not factor in to the production of hydrogen by electrolysis. Although hydrogen fuel produces emissions of nitrogen oxides and hydrogen peroxide pollutants, the amounts are about one-third lower than those produced from gasoline engines (Veziroglu and Barbir 1992). Based on this comparative analysis, hydrogen fuel may be a cost-effective alternative to gasoline, especially if the environmental and subsidy costs of gasoline are taken into account (Pimentel et al. 1994).
Based on the analysis by Pimentel and others of hydrogen gas use as an alternative fuel, it is clear that PA can benefit from hydrogen fuel cells in rural and suburban areas, and hydrogen fuels could revolutionize the transportation industry if it can be produced in large enough quantities, transported, and stored for use in automobiles.
Hydro power in PA (Steve’s
Part???)
Small scale and micro-scale hydro power would be the only sustainable alternative energy strategies to substitute for fossil fuel electricity generation in PA’s future energy mix. As we have discussed in class, large scale hydro power has too many negative environmental drawbacks to consider commissioning a new large-scale generation site.
Wind power in PA
For the following discussion of wind and solar power in PA, a selection of tables showing the average solar radiation for flat-plate collectors, and average climatic conditions (including average wind speeds) of various cities throughout PA are shown so that the effectiveness of wind or solar technologies can be compared.
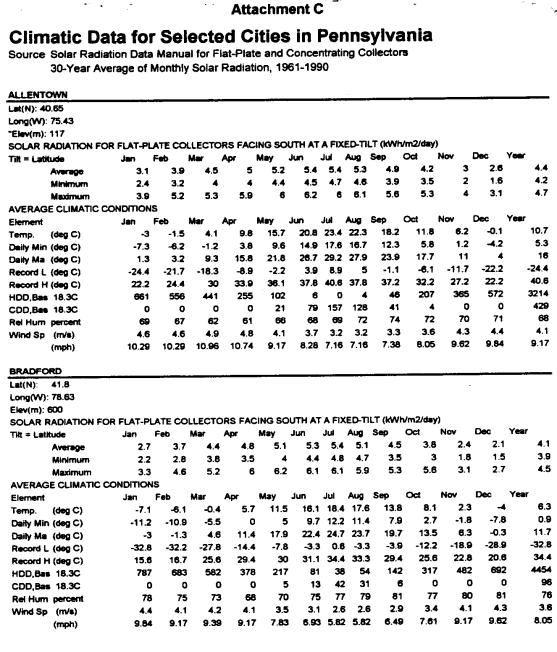
Table 1: Average solar radiation and climatic conditions for Allentown and Bradford, PA. 30-Year averages for monthly solar radiation, 1961-1990 (NCAT, 1999).
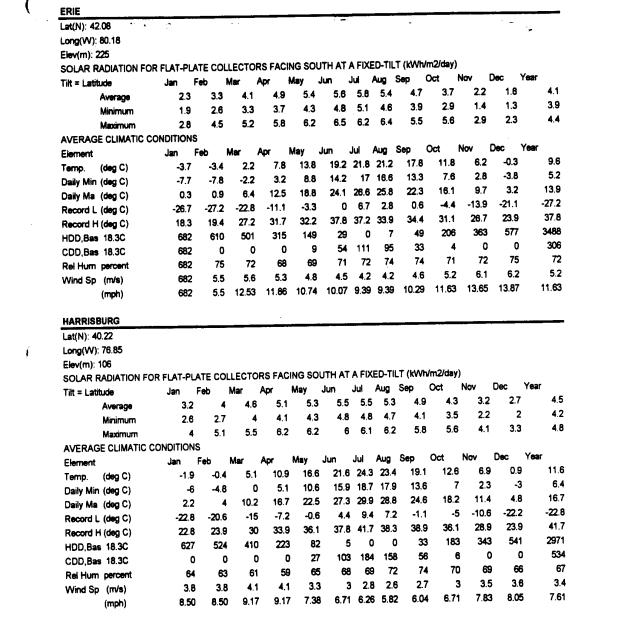
Table 2: Average solar radiation and climate conditions for Erie and Harrisburg, PA (NCAT, 1999).
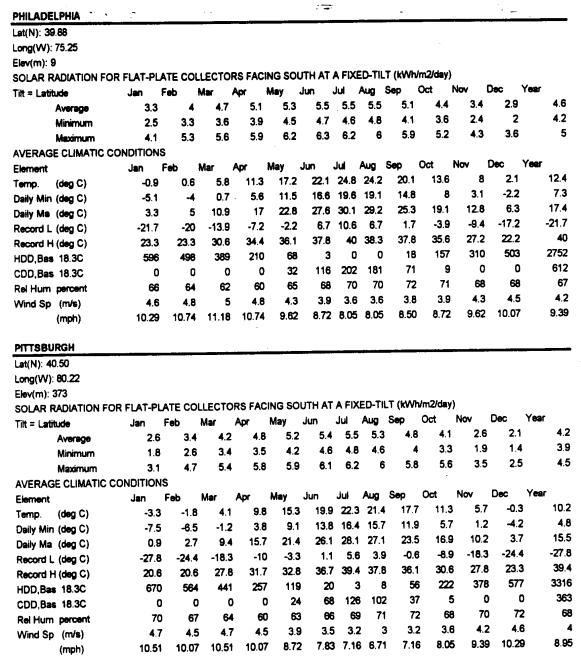
Table 3: Average solar radiation and climate conditions for Philadelphia and Pittsburgh, PA (NCAT, 1999).
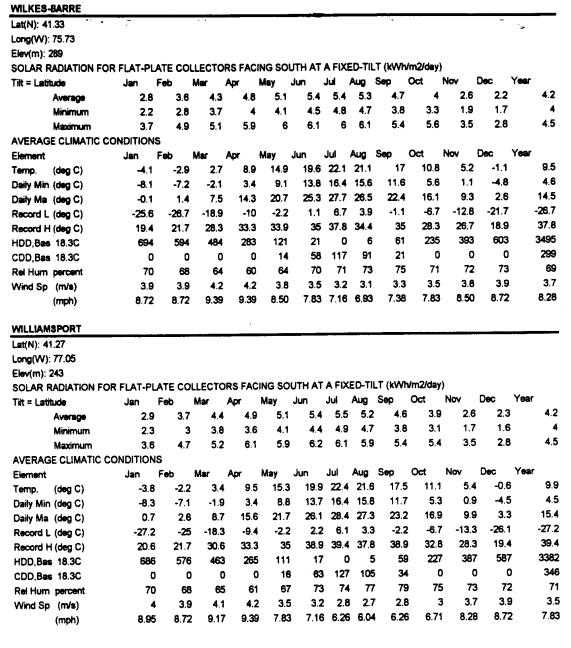
Table 4: Average solar radiation and climate conditions for Wilkes-Barre and Williamsport, PA (NCAT, 1999).
The Green Mountain Wind Farm in Garret, PA is a good example to show the potential for electricity generation by wind power for Pennsylvania.
Case Study: Green Mountain Wind Farm at Garrett, PA.
Pennsylvania has one of the largest operating wind power plants in the Mid Atlantic region. Construction on the Green Mountain Wind Farm in Garrett, PA began on December 1, 1999, and the 10.4 megawatt wind facility officially began serving Green Mountain customers on May 1, 2000. The location of Garrett, PA in relation to State College and Pittsburgh, PA and Washington D.C. is shown in Figure 1. A picture of two windmills at the farm is shown in Figure 2.

Figure 1: Location of Garrett, PA (star in middle of map) (Map provided by Mapquest.com, 2000).

Figure 2: Picture of two windmills from Garrett, PA wind farm courtesy of GreenMountain.com.
The wind farm consists of eight 200-foot high windmills, each with a tubular tower and three blades approximately 95 feet in length. Each turbine has a capacity of 1,300 kilowatts of electricity -- the wind farm altogether will generate enough electricity to power 2,500 average Pennsylvania households. And based on Pennsylvania's average electricity mix, every year this wind farm will displace up to 17,000 tons of carbon dioxide emissions (Green Mountain, 2000).
Distributed Generation Systems, Inc. (Disgen) completed an environmental impact study as part of the site selection process, and the results showed that a wind farm at this location will have no significant impact on bird populations, endangered and threatened species, wetlands, or sensitive habitats -- largely because the site is not on (or even within many miles of) any migratory pathways for waterfowl, shorebirds, hawks, or songbirds.
The wind farm is the result of a three-party agreement between Green Mountain Energy Company, Disgen, and American National Wind Power, the facility's owners.
The success of the Green Mountain wind farm proves that useful wind power can be produced in PA. Based on the average monthly wind speeds for the various cities in PA given in Tables 1-4, Erie, PA would have the greatest potential for wind power generation with an annual average wind speed of 5.2 m/s (11.63 mph) for most of the year. The Philadelphia, Allentown, Pittsburgh, Wilkes-Barre, Bradford, Williamsport and finally Harrisburg, PA areas in order of decreasing average wind speeds, would have the next greatest potential for generating electricity via wind power. However, other criteria would need to be evaluated, such as open space available for installation of wind farms, in order to determine which areas would be best for constructing new wind farms. For example, even though Philadelphia has one of the higher average annual wind speeds, there might not be as much open area, such as farm land to construct new wind farms.
Solar Power
Photovoltaics
Photovoltaic cells (PV) produce electricity when sunlight excites electrons in the cells. Because the size of the units is flexible and adaptable, photovoltaic cells are ideal for use in homes, industries, and utilities.
Before PV cells can be mass distributed, improvements are needed to make them economically competitive. Test photovoltaic cells that consist of silicon solar cells are currently up to 21% efficient in converting sunlight into electricity (Moore 1992). The durability of photovoltaic cells, which is now approximately 20 years, needs to be lengthened and current production costs reduced about fivefold to make them economically feasible (Pimentel et al. 1994). With a major research investment, all of these goals appear possible to achieve (DeMeo et al. 1991).
Currently, production of electricity from photovoltaic cells costs approximately 30¢/kWh, but the price is projected to fall to approximately 10¢/kWh by the end of the decade and perhaps reach as low as 4¢ by the year 2030, provided the needed improvements are made (Flavin and Lenssen 1991). In order to make photovoltaic cells truly competitive, the target cost for modules would have to be approximately 8¢/ kWh (DeMeo et al. 1991).
Placing the photovoltaic cells on the roofs of homes, industries, and other buildings would reduce the need for additional land use in PA as well as reduce the costs of energy transmission. However, photovoltaic systems require backup with conventional electrical systems, because they function only during daylight hours. PV systems can be used in conjunction with a net metering program where homeowners could sell excess electricity generated during the day back to the utility, and they would still be connected to the grid during night or other times of insufficient solar radiation.
Photovoltaic technology offers several environmental advantages in producing electricity compared with fossil fuel technologies. For example, using present photovoltaic technology, carbon dioxide emissions and other pollutants are negligible. The major environmental problem associated with photovoltaic systems is the use of toxic chemicals such as cadmium sulfide and gallium arsenide, in their manufacture (Holdren et al. 1980). Because these chemicals are highly toxic and persist in the environment for centuries, disposal of inoperative cells could become a major environmental problem. However, the most promising cells in terms of low cost, mass production, and relatively high efficiency are those being manufactured using silicon. This material makes the cells less expensive and environmentally safer than the heavy metal cells.
Case Study: Green Mountain solar plant, Conshohocken, PA
Using solar facilities like Green Mountain’s new Pennsylvania plant to convert solar radiation into electricity has the potential to help the United States reduce carbon dioxide emissions as required under the Kyoto climate change accord. Solar technology currently holds widespread support within the environmental community and among the general public, and is used in various forms by more than 200,000 homeowners in the United States. It is also the word’s fastest growing energy source (GreenMountain.com, 2000).
Stephen Cowell, President of Sun Power Electric, said, "We’ll build as much solar capacity as Green Mountain’s Pennsylvania customers demand. This is an enormous opportunity for consumers to bring new renewables generation to the marketplace and to change the way power is made."
The solar array at Conshohocken, PA (Figure 3) is part of the largest solar generation facility ever built in Pennsylvania. Green Mountain and Sun Power Electric joined in the project to install 1,400 solar panels on the roof of BJ's Wholesale Club in Conshohocken, PA. The 43 kilowatt array will produce 50,000 kilowatt hours of clean electricity each year for 20 years. Based on the emissions from Pennsylvania's average electricity mix, this solar facility will displace 34.5 tons of carbon dioxide emissions every year (GreenMountain.com, 2000).

Figure 3: Map of Conshohocken area courtesy of MapQuest.com, 2000.
All cities in Tables 1-4 show similar average annual solar radiation values (4.1-4.6 kWh/m2/day) therefore, it would be reasonable to assume that solar plants like the one in Conshohocken would be viable options almost anywhere in the state.
Geothermal Power
(Covered by Steve)?
Policy implications and Conclusions
Energy efficiencies for both coal and nuclear fuels are low due to the thermal law constraint of electric generator designs: coal is approximately 35% efficient and nuclear fuels approximately 33% (West and Kreith 1988). Both coal and nuclear power plants in the future may require additional structural materials to meet clean air and safety standards. The costs of producing electricity using coal and nuclear energy are 3 ¢ and 5¢ per kWh, respectively (EIA 1990). However, the costs of this kind of energy generation are artificially low because they do not include such external costs as damages from acid rain produced from coal and decommissioning costs for the closing of nuclear plants. The Clean Air Act and its amendments could raise coal generation costs, while the new reactor designs, standardization, and streamlined regulations may reduce nuclear generation costs (Pimentel et al. 1994). Government subsidies for nuclear and coal plants also skew the comparison with solar energy technologies (Wolfson 1991).
Economic costs of fossil energy use are clouded by the direct and indirect US subsidies that hide the true cost of energy and keep the costs low, thereby encouraging energy consumption (Pimentel et al. 1994). The energy industry receives a direct subsidy of $424 per household per year (based on an estimated maximum of $36 billion for total federal energy subsidies (ASK 1993). In addition, the mined-energy industry, like the gasoline industry, does not pay for the environmental and public health costs of fossil energy production and consumption.
Many environmental problems are associated with both coal and nuclear power generation. For coal, the problems include the substantial damage to land by mining, air pollution, acid rain, global warming, as well as the safe disposal of large quantities of ash (Wolfson 1991). For nuclear power, the environmental hazards consist mainly of radioactive waste that may last for thousands of years, accidents, and the decommissioning of old nuclear plants (Wolfson 1991). Fossil-fuel electric utilities account for two-thirds of the sulfur dioxide, one-third of the nitrogen dioxide, and one-third of the carbon dioxide emissions in the United States (Kennedy et al. 1991). Removal of carbon dioxide from coal plant emissions
could raise costs to 12¢/kWh; a disposal tax on carbon could raise coal electricity costs to 18¢/kWh (Williams et al. 1990).
The occupational and public health risks of both coal and nuclear plants are fairly high, due mainly to the hazards of mining, ore transportation, and subsequent air pollution during the production of electricity (Pimentel et al. 1994). However, there are 22 times as many deaths per unit of energy related to coal than of nuclear energy production because 90,000 times greater volume of coal than nuclear ore is needed to generate an equivalent amount of electricity (Pimentel et al. 1994).
Coal also produces more diffuse pollutants than nuclear fuels during normal operation of the generating plant. Coal fired plants produce air pollutants such as, sulfur oxides, nitrogen oxides, carbon dioxide, and particulates that adversely affect air quality and contribute to acid rain. Technologies do exist for removing most of the air pollutants, but their use increases the cost of a new plant by 20-25% (IEA 1987).
Based on Pimentel’s and other’s findings, it is imperative to speed the transition from reliance on nonrenewable energy sources to reliance on renewable energy technologies. Various combinations of renewable technologies should be developed that are consistent with the characteristics of the different geographic regions of PA, taking into account the land and water available and regional energy needs. If Pennsylvania does not commit itself to the transition from fossil to renewable energy soon, its economy and environment could be adversely affected. PA residents must work together to conserve energy, land, water, and biological resources. Finally Pimentel states that “To ensure a reasonable standard of living in the future, there must be a fair balance between human population density and energy, land, water, and biological resources.”
APPENDIX A
Duquesne Light Brunot Is 414 Duquesne Light Elrama 510 Duquesne Light Cheswick 565 Metropolitan Edison (GPS) Portland 427 Metropolitan Edison (GPS) Titus 225 Pennsylvania Electric (GPS) Conemaugh 1872 Pennsylvania Electric (GPS) Homer City 2012 Pennsylvania Electric (GPS) Seward 218 Pennsylvania Electric (GPS) Shawville 625 Pennsylvania Electric (GPS) Warren 85 Pennsylvania Electric (GPS) Keystone 1872 Pennsylvania Power and Light Brunner Island 1559 Pennsylvania Power and Light Holtwood 75 Pennsylvania Power and Light Martins Creek 2014 Pennsylvania Power and Light Montour 1642 Pennsylvania Power and Light Sunbury 410 Pennsylvania Power and Light Marcus Hook Pennsylvania Power New Castle 506 Pennsylvania Power Bruce Mansfield 2741 Philadelphia Electric Cromby 418 Philadelphia Electric Delaware 313 Philadelphia Electric Eddystone 1489 Philadelphia Electric Schuylkill 240 West Penn Power (APS) Armstrong 326 West Penn Power (APS) Hatfield 1728 West Penn Power (APS) Mitchell 449 West Penn Power (APS) Springdale 215 TOTAL 22,950
Bibliography
Annual Energy Outlook with Projections to 2010. DOE, Energy Information Administration, Washington, DC. 199lb. 1989 International Energy Annual/. DOE, Washington, DC.
Chung, W. Cannon, J. Roberts, L. Bluman, and J. Gregg. 1994. Achieving a secure energy future: environmental and economic issues. Ecological Economics, 9: 201-219.
DOE Energy Information Administration. (1998). State Electricity Profiles.
DOE Health Effects of Residential Wood Combustion: survey of Knowledge and Research. DOE, Technology Assessments Division, Washington, DC.1990. The Potential of Renew able Energy. SERI, DOE, Golden, CO. 1991a.
DOE Renewable Energy Annual (1999) US DOE
Energy Information Administration (EIA). 1990. Electric Plant Cost and Power Production Expenses. EIA, Washington, DC.
Electric Power Research Institute (EPRI). 1991.
Photovoltaic system performance assessment for1989. EPRI Interim Report 65-7286. EPRI, Los Angeles, CA.
Hall, C. A. S., C. J. Cleveland, and R. L. Kaufmann. 1986. Energy and Resource Quality: The Ecology of the Economic Process. Wiley, New York.
Hall, D. O., F. Rosillo-Calle, R. H. Williams, and J. Woods. 1993. Biomass for energy: supply prospects. In T. B. Johansson, H. Kelley, A. K. N. Reddy, and R. H. Williams, eds. Renewable Energy. Island Press, Washington, DC.
Kohl, W. L. 1990. Methanol as an Alternative Fuel Choice: An Assessment The Johns Hopkins Foreign Policy Institute, Washington, DC.
Kuliasha, A. Zucker and K. J. Ballew, eds. Technologies for a Greenhouse-constrained Society. Lewis, Boca Raton, FL.
PA Electricity and Renewable Energy (1998) PA PUC
PennPirg Clean Air Advocate. http://pirg.org/pennpirg/press/air/hbg.html
Pimentel, D. 1991. Ethanol fuels: Energy security, economics, and the environment. Journal of Agricultural and Environmental Ethics 4: 1-13.
Pimentel, D. 1992. Competition for land: development, food, and fuel. Pages 325-348 in M. A.
Pimentel, D., L. Levitan, J. Heinze, M. Loehr, W. Naegeli, J. Bakker, J.
Eder, B. Modelski, and M. Morrow. 1984. Solar energy land and biota. SunWorld 8: 70-73 93-95.
Pimentel, D., M.
Herdendorf, S. Eisenfeld, L. Olanden M. Carroquino, C. Corson, J. McDade Y.
Pimentel and others. 1994. Renewable Energy: Economic and Environmental Issues. BioScience -- Vol. 44, No. 8, September 1994.
State Climatologist, Pennsylvania. http://www.ems.psu.edu/PA_Climatologist/
Swisher, Jannuzzi, and Redlinger. Tools and Methods for Integrated Resource Planning. Grafisk Service, Riso National Laboratory, Denmark, Nov 1997.
US Bureau of the Census (USBC). 1992a. Statistical Abstract of the United States 1992. US Government Printing Office, Washington, DC. 1992b. Current Population Reports. January ed. USBC, Washington, DC.
US Department of Agriculture (USDA).1992. Agricultural Statistics. US Government Printing Office, Washington, DC.
Voigt, C. 1984. Material and energy requirements of solar hydrogen plants. International Journal of Hydrogen Energy 9: 491-500.
World Book Encyclopedia Online. http://www.worldbook.com/fun/atw/climates/pennsylvania.htm