Color Plate 2.A: A leaf on a pond (courtesy Charles Hosler)
EXTRA : Latest
North America visible satellite photograph
Color Plate 3.A NASA satellite data shows day/night
variability of land and oceans in January (courtesy JPL)
EXTRA :
Latest 200-mb wind speed/direction locates the
jet stream over North America
Color Plate 8.A: Cloud-to-ground lightning
stroke
Color Plate 9.A: Observed sea-surface temperature and
anomalies in the Pacific in December 1997 during El Nino
EXTRA :
Latest Goes-8 IR view of Western Hemisphere (shows global cloud patterns)
Color Plate 10.A: Color-enhanced infrared image
of Hurricane Mitch
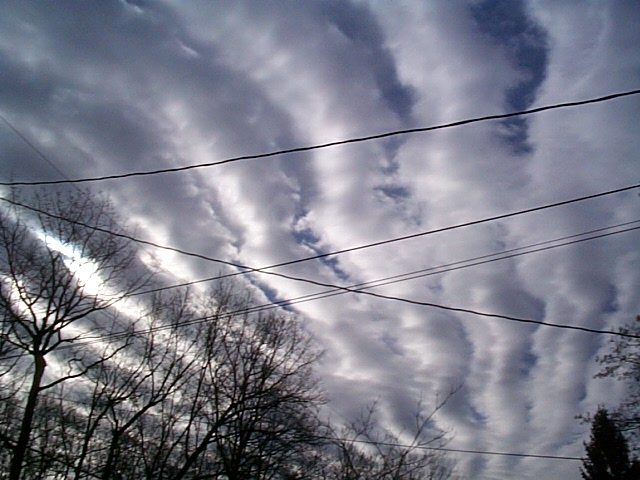
Color Plate 12.A: Cirrus clouds
(courtesy Dr. Dave Babb)
Color Plate 14.A : Tornado near Omaha, NE on May 6,
1975 (courtesy of Bob Dunn)
Color Plate 17.A: Fog forms from smokestack effluent
(courtesy of Alistair Fraser)
EXTRA : Another example of the urban heat island
detected from space
Figure 1.10: Snowfall from Blizzard of January 6-8, 1996
Color Plate 1.C: Colorized isoplethed map
of snowfall from Blizzard of 1996 (courtesy Penn State Weather Communications)
Figure 2.10: Absorptivity of
various atmospheric gases and the atmosphere as a whole
Figure 2.13a: Visible satellite image
Figure 2.13b: Infrared satellite image
Figure 2.13c: Water vapor satellite image
Color Plate 2.B: Clematis plant shows
evidence of low-level cold air
Color Plate 2.C: Colorized infrared image
of space shuttle
Color Plate 2.D: Modern colorized radar display (courtesy WSI)
Color Plate 2.E: Hook echo on Doppler radar (reflectivity)
Color Plate 2.F: Hook echo on Doppler radar (velocity)
EXTRA : Latest
North America infrared satellite photograph
EXTRA : Latest
North America water vapor satellite image
Figure 3.12 : A Stevenson Screen
Color Plate 3.B: Gulf stream seen from
space via IR sensing of sea surface temps
Figure 4.1 : Visible satellite image of powerful
Great Lakes storm in November 1998
Figure 4.3 : Toricelli's mercury barometer
Color Plate 5.A: Water vapor image with upper-level
winds on February 22, 1998
Color Plate 6.A: Average annual liquid precipitation in
northern California (courtesy Oregon Climate Service)
Color Plate 6.B: Topographic map of northern California (copyright
Ray Sterner, Johns Hopkins University APL)
Color Plate 7.B: Cumulus congestus clouds
(courtesy Dr. Dave Babb)
Color Plate 7.D: Stratus clouds
(courtesy Dr. Dave Babb)
Color Plate 7.F: Altostratus clouds
(courtesy Dr. Dave Babb)
Color Plate 7.G: Nimbostratus clouds
(courtesy Dr. Dave Babb)
Color Plate 7.H: Overshooting tops
Color Plate 7.I: Cirrocumulus clouds
(courtesy Dr. Dave Babb)
Color Plate 7.J: Altocumulus clouds
(courtesy Dr. Dave Babb)
Figure 8.9: Large-scale view of
sea-breeze fronts forming thunderstorms along both coasts
Figure 8.11 : Visible satellite image of thunderstorms
over the mountains of the western United States
Figure 8.14: Visible satellite image of
tornadic supercell thunderstorm
Figure 8.15: Sequence of satellite images showing the life cycle of
an MCC:
Color Plate 8.B : Satellite view of
thunderstorms along the sea-breeze front
Color Plate 8.C : Mammatus clouds
Color Plate 8.D: Gust front and sea-breeze front visible
on Doppler radar
Color Plate 8.E : Dust storm produced by a
gust front
Color Plate 8.F : Results of flash flooding
over Mexico
Color Plate 8.G : Coffeyville, KS, hailstone
Color Plate 8.H : Reflectivity cross section of a strong
thunderstorm shows hail
Color Plate 8.I : Doppler radar velocity image
shows a microburst
Figure 9.2: Global montage of infrared satellite images
Color Plate 9.B: El Nino anomalies (N.H. winter)
Color Plate 9.C: El Nino anomalies (N.H. summer)
EXTRA :
Latest Goes-9 IR view of Western Hemisphere (shows global cloud patterns)
EXTRA :
Latest Global IR view (useful to show global cloud patterns)
EXTRA :
Latest Global satellite colorized montage (shows global cloud patterns)
EXTRA:
El Nino Home Page - Everything you want to know about El Nino
EXTRA :
Risk of temp/precip anomalies in US during El Nino (any season)
Figure 10.1: Visible image of Hurricane Camille
Figure 10.2: Oceanfront apartment complex
(a) Before and
(b) After Hurricane Camille
Figure 10.4: Hurricane basins
Figure 10.5: Daily frequency of
tropical storms and hurricanes in the Atlantic basin
Figure 10.8: Three-dimensional
hurricane wind circulation
Figure 10.14: Hurricane Felix (1995)
Color Plate 10.B: Georges as a weak tropical storm
in the Central Atlantic
Color Plate 10.C: Montage of satellite images of Hurricane
Georges
Color Plate 10.D: Path of Georges (courtesy Dr. Steve Babin,
Johns Hopkins APL)
Color Plate 10.E: Damage in Florida from Hurricane Andrew
Figure 12.9b: Conveyor belts of a mature
mid-latitude low pressure system
Figure 12.14: A highly occluded low
Color Plate 13.A: Destruction from Oklahoma tornado
on May 3, 1999
Color Plate 13.B: Destruction from Oklahoma tornado
on May 3, 1999
Color Plate 13.C: Examples of severe weather
watch boxes
Color Plate 13.D: Radar-reflectivity pattern of a
warm-season derecho
Color Plate 13.E: Doppler velocity image of derecho
in Color Plate 13.D
Figure 14.1: Airborne dirt and
dust mark the bottommost part of a tornado (courtesy Larry Fesser)
Figure 14.13: A wall cloud
Figure 14.14: A funnel cloud lowers
from a wall cloud
Color Plate 14.B : A white tornado (copyright Ian
Wittmeyer)
Color Plate 14.C : A landspout
Color Plate 14.D : Reflectivity images of tornadic supercells
over Oklahoma on May 3, 1999
Color Plate 14.E : Doppler radar velocity image of the
F5 tornado in central Oklahoma on May 3, 1999
Color Plate 14.G : Cycloid pattern of damage from
May 3, 1999 Oklahoma tornado
Figure 17.1: Nighttime views from space:
(a) Global,
(b) North America
Figure 17.2: Soot-darkened snow
surrounding Troisk, Siberia
Figure 17.5: Biomass burning in Brazil
Figure 17.14: Ash cloud from Mount
St. Helens seen on satellite image
Figure 17.21: Albedo differences
between forested and non-forested areas in winter
Figure 17.23: The urban heat island
detected from space using an infrared image
Color Plate 17.B: The ozone hole in
early October 2000
Color Plate 17.C: Haze over the Amazon
Color Plate 17.D: Deforestation in the
Amazon River basin
EXTRA : Clouds bubble over deforested Amazon land but not over the river
EXTRA : Seasonal biomass burning in India
EXTRA : The patterns of deforested land in Brazil
EXTRA : Lights of the eastern United States
EXTRA : October ozone since 1979 in the vicinity of the Antarctic
EXTRA : Amazon, 1975 -vs- 1988,
showing atmospheric effects of deforestation