Size matters!
What kinds of things
can we observe with x-rays? If
we make a few simple calculations using Braggs' law
lambda = 2d sin theta
we can get some ideas. Suppose we use CuKalpha radiation
(lambda = 1.5418 Å), and calculate 2theta for various values of "d",
where "d" is now considered an 'interaction distance'.
d
2theta
q
10
Å (0.001 micron)
8.84°
0.628 Å-1
50
Å
1.77°
100
Å (0.01 micron)
0.88°
0.0628 Å-1
300
Å
0.29°
600
Å
0.15°
1000
Å (0.1 micron)
0.09°
0.00628 Å-1
10,000
Å (1 micron)
0.009°
0.000628 Å-1
q
= (4/lambda) sin theta = 2/d
From the results
above, we can see that high-angle x-ray scattering, usually about 2°2theta
to 160°2theta gives information about the structure on an atomic scale.
We may even be able to extract atomic scale information from scattering
data for crystalline substances with large interaction distances at angles
smaller than 2°. As we go to lower scattering angles,
we can measure larger "things".
What are these larger
"things"?
Examples
1. WAXS
and SAXS study of (m)TMXDI-PDMS siloxane-urethaneureas
FIBRES
& TEXTILES in Eastern Europe (January/December 2003), 11, No. 5, 44
http://www.fibtex.lodz.pl/44_23_107.pdf
The (m)TMXDI-PDMS
polymer molecule consists of soft and hard chain segments as shown below.

The hard segments
form regions with crystal-like order, phase regions surrounded by the amorphous
siloxane segment chains.
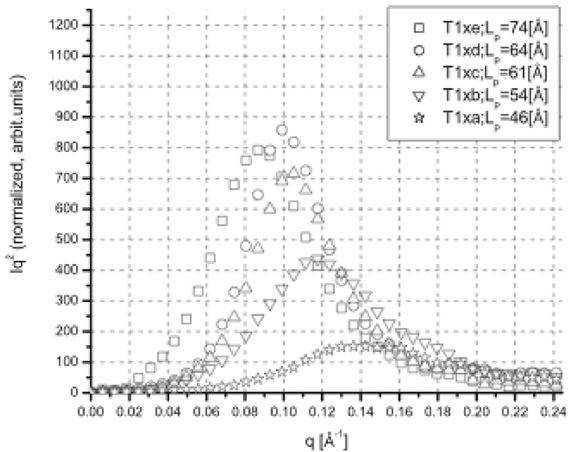
Below are shown saxs
measurements for these polymers with different compositions. From the scattering curves, it is
seen that, as the NCO/OH ratio (a = 1.5/1; e = 4.5/1) increases, the position
of the scattering maximum moves closer to q = 0.
Thus, the size of the hard segment "crystalline" regions
increases as the fraction of the diisocyanate increases.
2. Microstructure
orientation and nanoporous gas transport in semicrystalline block
copolymer membranes
Polymer
(2000), 41, 46714677
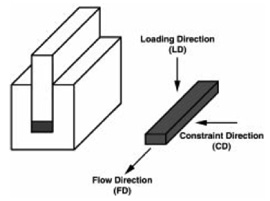
Channel die processing
(see figure below) of semicrystalline ethylene (E)/ethylenepropylene (EP)
diblock E/EP and triblock E/EP/E copolymers results in orientation of the
block copolymer lamellar microstructure both parallel and perpendicular
to the direction of shear. Gas permeability in these oriented block copolymer
systems varies: parallel --> lower permeability, and perpendicular -->
higher permeability (see 2nd figure below).

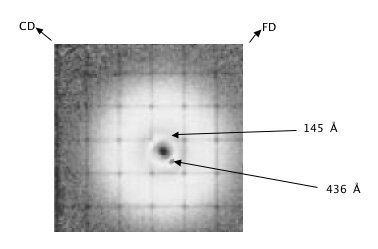
saxs was used to obtain
the lamellar periodicity.
This saxs photo was
for the perpendicular texture type. (Ignore grid instrument artifact)
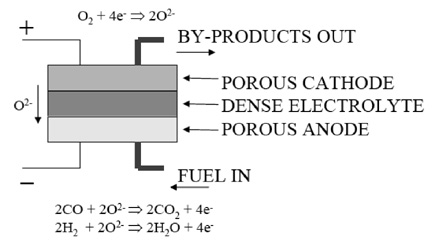
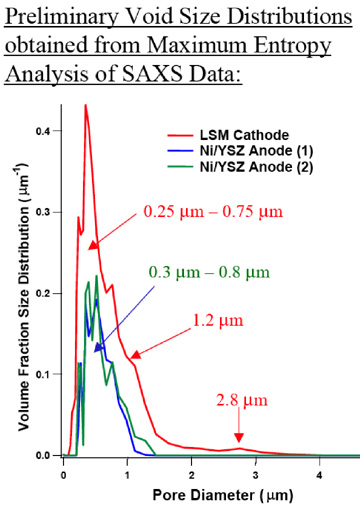
3. Nanometer
to Micrometer Void Microstructure Characterization of SOFC Layers
and Interfaces by Small Angle Scattering (SAXS) and Computed X-ray Microtomography(XMT)
http://www.netl.doe.gov/publications/proceedings/03/seca
core/Andrew Allen NIST.pdf
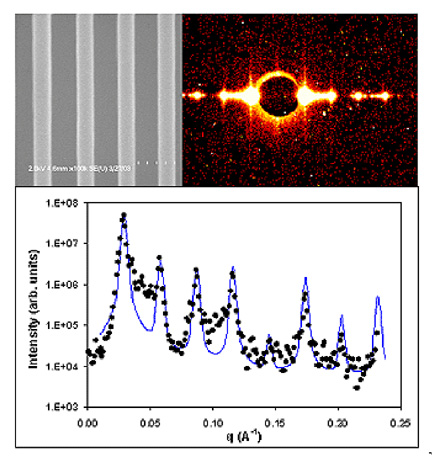
The fuel cell configuration is shown
below.
This cross-section
micrograph shows the porosity.
4. Critical
Dimension Metrology of Nanoscale Structures with Small Angle X-ray Scattering
http://polymers.msel.nist.gov/highlights/Critical-Dimension-Metrology-Nanoscale-Structures-Small-Angle-X-ray-Scattering.html
NIST is developing
a transmission x-ray scattering based method capable of angstrom level precision
in critical dimension evaluation over large, (50 x 50) mm, arrays of nanoscale
periodic structures. With a wave-length more than an order of magnitude
smaller than the pattern size, patterns can be analyzed using methods traditionally
employed in crystallographic diffraction.

SAXS geometry, showing incident and scattered
beams (red lines), sample with pattern oriented at rotation angle w, and
2-D detector (right).
SEM image (top left) of a photoresist grating
on a silicon wafer compared to the resulting 2-D SAXS image (top right).
The diffraction peaks were fit with a simple model (solid blue line).
Streaks of intensity
emanating from diffraction peaks are indicative of deviations from the ideal
grating and may provide information about defects such as long wavelength
line edge roughness.
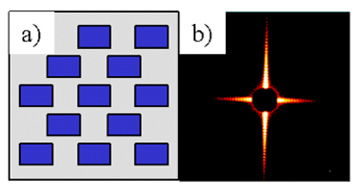
(a)
blue rectangles represent etched regions in a film, and (b) the resulting
SAXS detector image.
5. The measurement
of the micro-fibril angle in soft-wood
JOURNAL
OF MATERIALS SCIENCE LETTERS 20, 2001, 2245 2247
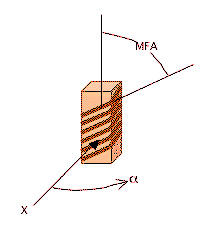
The major
portion of the wall of a wood cell consists of bundles of a crystalline
arrangement of cellulose chains (microfibrils). The microfibrils align quite parallel and are arranged
in a spiral around the cell wall, with the axis of the spiral along the
vertical or long cell direction.
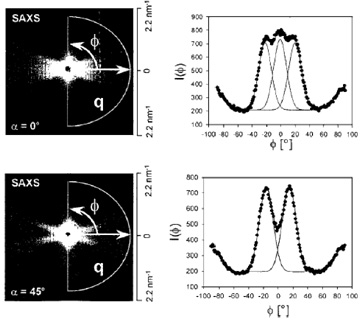
Above are shown typical
scattering patterns from a Norway spruce sample with a mean MFA of 20°.
The longitudinal cell axis was vertical. (c) SAXS pattern recorded at alpha
= 0°.
The two-dimensional image shows three streaks of high intensity. Integration
over the scattering vector q gave a curve with three peaks that were fitted
with three Gaussians, giving a MFA of 20.0±0.6°. (d) SAXS pattern recorded at alpha
= 45°. In the scattering pattern one can see two streaks of high intensity.
The curve resulting from integration was fitted with two Gaussians. The
MFA was determined to be 20.4±0.6°.
